




EURJPY In FocuS Downside Levels to Watch After a Big Bearish Reversal
EUR/JPY is the day’s biggest mover among the major currencies
Share this:

In news that essentially no one was surprised to hear, the US National Bureau of Economic Research officially declared that the US economy fell into recession in February this year, ending the longest-ever US economic expansion at 128 months. Traders, always the forward-looking bunch, have taken this news mostly in stride as they look ahead to the prospect of a potentially strong economic recovery, goosed by 13 figures ($10T+) of global stimulus measures.
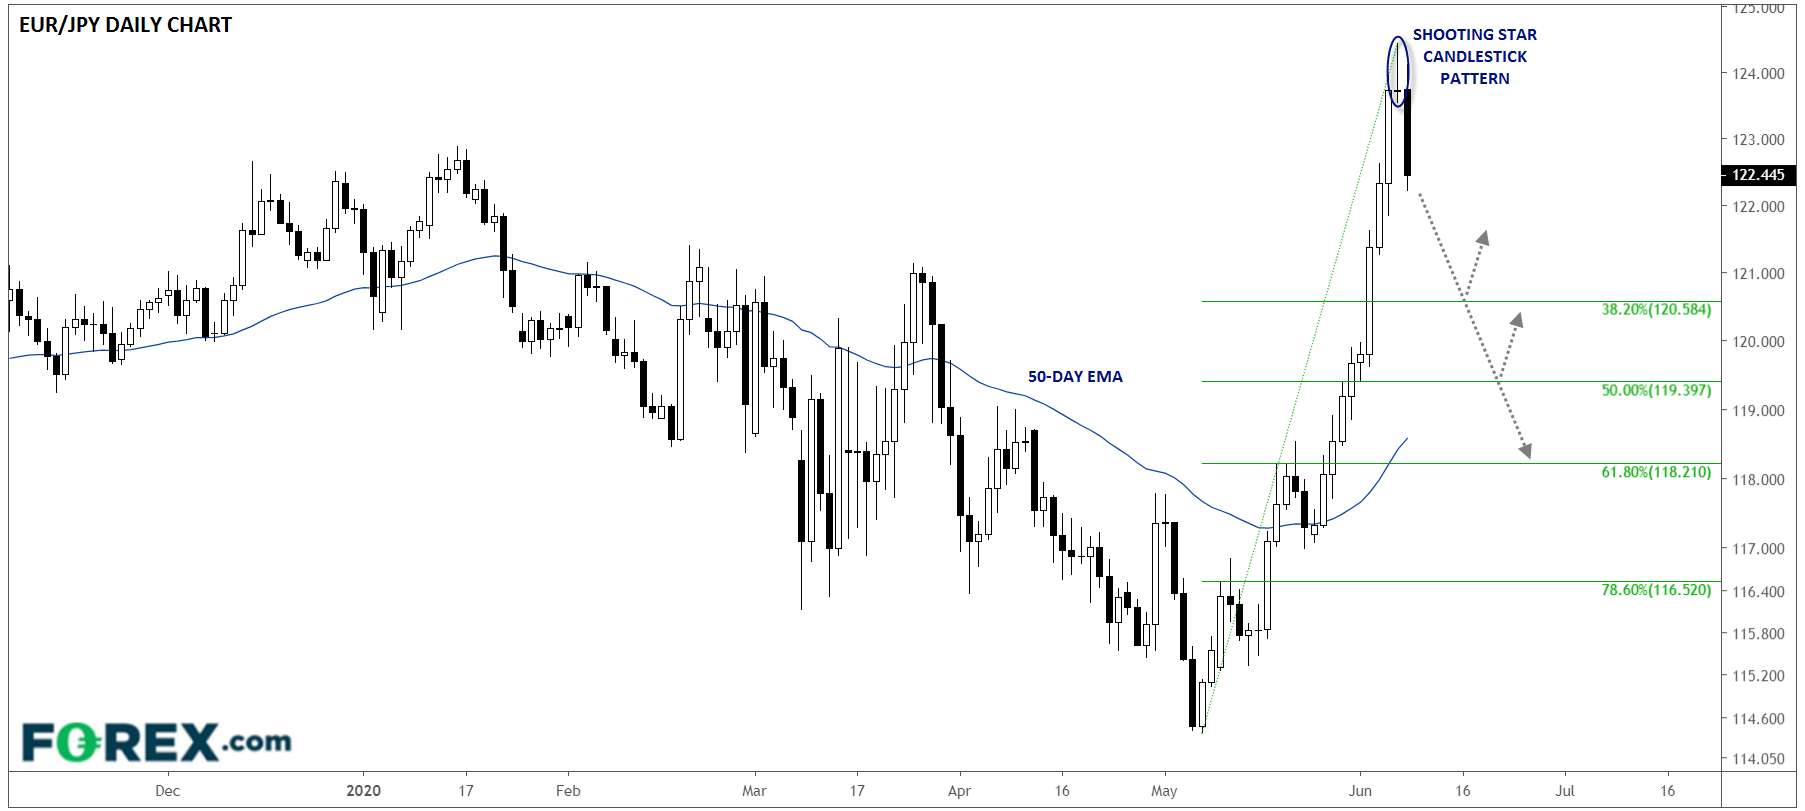
In the FX market, EUR/JPY is the day’s biggest mover among the major currencies. After rising for nine straight days, the pair finally traded lower on Friday, forming a “shooting star” candlestick formation in the process. This pattern shows an intraday shift from buying to selling pressure and is often seen at near-term tops in the market. With rates falling sharply today, that near-term top has been confirmed, opening the door for a deeper retracement as we move through the week:
Source: TradingView, Gain Capital
From a purely technical perspective, the Fibonacci retracements of the May surge may be logical levels for EUR/JPY bears to target. In that vein, we’ll be keeping a close eye on 120.60 (the 38.2% Fibonacci retracement), 119.40 (50%) and 118.20 (61.8%) as potential downside objectives. Meanwhile, only a sharp bullish reversal and break above Friday’s high at 124.40 would erase the near-term bearish bias.
In news that essentially no one was surprised to hear, the US National Bureau of Economic Research officially declared that the US economy fell into recession in February this year, ending the longest-ever US economic expansion at 128 months. Traders, always the forward-looking bunch, have taken this news mostly in stride as they look ahead to the prospect of a potentially strong economic recovery, goosed by 13 figures ($10T+) of global stimulus measures.
In the FX market, EUR/JPY is the day’s biggest mover among the major currencies. After rising for nine straight days, the pair finally traded lower on Friday, forming a “shooting star” candlestick formation in the process. This pattern shows an intraday shift from buying to selling pressure and is often seen at near-term tops in the market. With rates falling sharply today, that near-term top has been confirmed, opening the door for a deeper retracement as we move through the week:
Source: TradingView, Gain Capital
From a purely technical perspective, the Fibonacci retracements of the May surge may be logical levels for EUR/JPY bears to target. In that vein, we’ll be keeping a close eye on 120.60 (the 38.2% Fibonacci retracement), 119.40 (50%) and 118.20 (61.8%) as potential downside objectives. Meanwhile, only a sharp bullish reversal and break above Friday’s high at 124.40 would erase the near-term bearish bias.


The complete CFD trading experience
Award-winning platforms, competitive spreads, low commissions and dedicated support.
We live and breathe the markets and are dedicated to helping traders realise their ambitions as we continue to set the industry bar.
Economic calendar
Web Trader platform
Our sophisticated web-based platform is packed with features.
Related articles

USD/CAD shooting star puts September surge on notice
USD/CAD has printed a clear bearish reversal pattern after an extraordinary September surge, but confirmation may depend heavily on how US Treasury yields react to Friday’s payrolls report.


USD/MXN Analysis: Is Super Peso Starting to Fade?
Over recent trading sessions, the Mexican peso has continued to show signs of weakness against the U.S. dollar. This can already be seen in USD/MXN, which has gained more than 1.7% over the last three sessions, highlighting sustained buying pressure in favor of the dollar in the short term.


Canadian Dollar Analysis: USD/CAD Returns to July Highs Ahead of NFP
The Canadian dollar continues to face one of its most challenging environments in recent months when it comes to maintaining strength against the U.S. dollar. The weakness of the Canadian currency is clearly reflected in USD/CAD, which has now recorded nine consecutive bullish sessions and gained more than 1.7% during that period.
StoneX Europe Ltd may make third party material available on this website which may contain information included but not limited to the conditions of financial markets. The material is for information purposes only and does not contain, and should not be construed as containing, investment advice and/or investment recommendation and/or an investment research and/or an offer of or solicitation for any transactions in financial instruments; any decision to enter into a specific transaction shall be made by the client following an assessment by him/her of their situation.
StoneX Europe Ltd makes no representation or warranty and assumes no liability as to the accuracy or completeness of the information provided, nor any loss arising from any investment based on a recommendation, forecast or other information supplied. You should always seek independent advice as to your suitability to speculate in any related markets and your ability to assume the associated risks, if you are at all unsure. We are not under any obligation to update any such material. Any opinion made may be personal to the author and may not reflect the opinion of StoneX Europe Ltd.