



European Open: 2020 high appears within easy reach for the FTSE 100
Whether the FTSE can tap that level today remains to be seen, but we can say the 2020 high is within a day’s average daily range away.
Share this:

Asian Indices:
- Australia's ASX 200 index rose by 20.2 points (0.28%) and currently trades at 7,288.50
- Japan's Nikkei 225 index has risen by 86.24 points (0.31%) and currently trades at 27,666.11
- Hong Kong's Hang Seng index has fallen by -89.95 points (-0.36%) and currently trades at 24,740.04
- China's A50 Index has fallen by -110.85 points (-0.73%) and currently trades at 15,031.74
UK and Europe:
- UK's FTSE 100 futures are currently down -1 points (-0.01%), the cash market is currently estimated to open at 7,642.42
- Euro STOXX 50 futures are currently up 8 points (0.19%), the cash market is currently estimated to open at 4,212.09
- Germany's DAX futures are currently up 12 points (0.08%), the cash market is currently estimated to open at 15,494.01
US Futures:
- DJI futures are currently up 5 points (0.01%)
- S&P 500 futures are currently down -44.75 points (-0.3%)
- Nasdaq 100 futures are currently down -8.25 points (-0.18%)
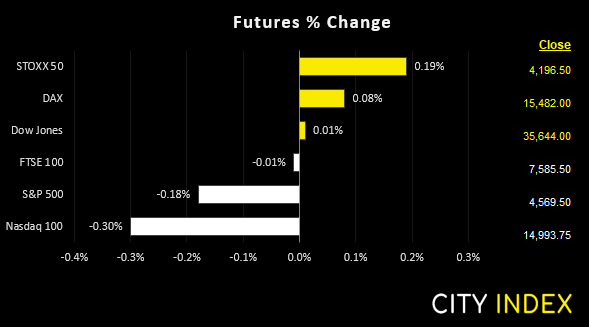
Equity markets were mixed overnight and volatility was lower ahead of today’s inflation report for the US. China’s indices handed back of some of yesterday’s gains and were the weakest performer, with the CSI 300 down -0.74% and the China A50 of around -0.6%. The ASX 200 was off to a strong start and tested the upper bound of the 7300 – 7342 zone mentioned in today’s Asian open report, yet now appears on track to close with a bearish hammer having handed back around 2/3rd of the day’s earlier gains. Futures markets are also slightly mixed with US indices slightly lower as they retraced against yesterday’s bullish closes.
FTSE 100 hit a 2-year high
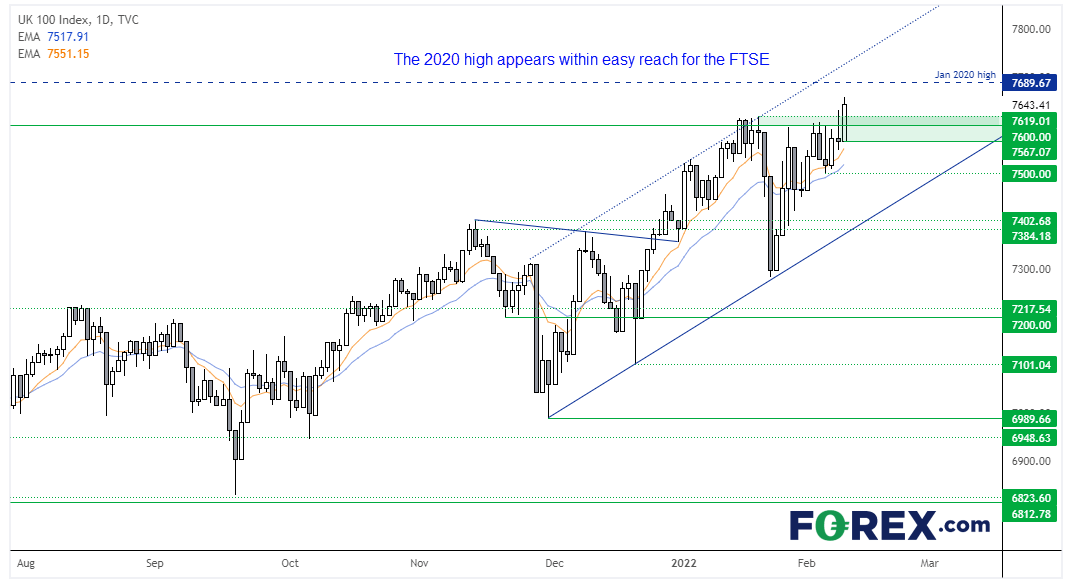
As always, the FTSE kept us guessing as to whether it would breakout or not. And who could blame us with several failed attempts to do so, with a few reversal candles along the way. Yet by yesterday’s close it had finally broken above 7619 on above-average volume for the day. The British pound is going through a spell of weakness and that could be beneficial for the FTSE to at least hold onto gains. But should prices pull back then obvious areas to seek levels of support include 4600 and 7619. A break beneath yesterday’s low of 7567 invalidates our near-term bullish bias. Until then, we’ll use the Jan 2020 high and the upper trendline as potential bullish targets.
FTSE 350: Market Internals


FTSE 350: 4310.23 (1.01%) 09 February 2022
- 315 (90.00%) stocks advanced and 33 (9.43%) declined
- 9 stocks rose to a new 52-week high, 4 fell to new lows
- 39.43% of stocks closed above their 200-day average
- 40.29% of stocks closed above their 50-day average
- 19.71% of stocks closed above their 20-day average
Outperformers:
- + 11.26% - Micro Focus International PLC (MCRO.L)
- + 9.70% - TUI AG (TUIGn.DE)
- + 7.45% - Aston Martin Lagonda Global Holdings PLC (AML.L)
Underperformers:
- -3.49% - EVRAZ plc (EVRE.L)
- -2.90% - Chemring Group PLC (CHG.L)
- -2.27% - Tate & Lyle PLC (TATE.L)
Currencies trade in tight ranges ahead of US CPI
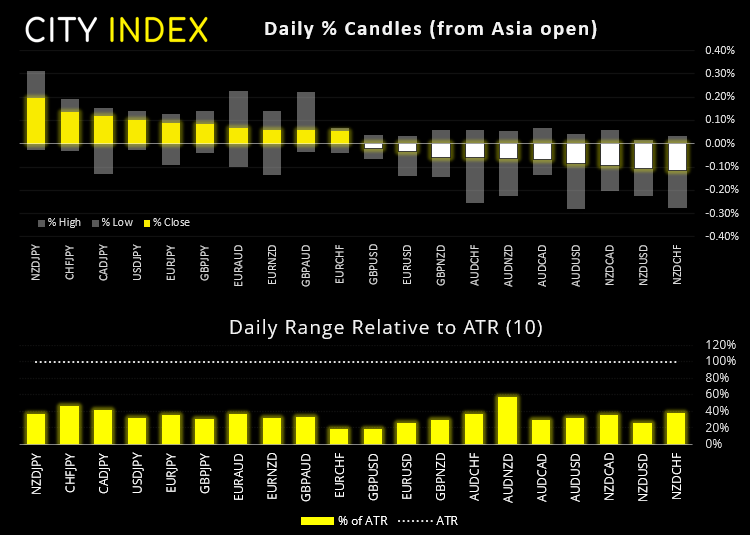

Inflation is expected to rip to a new 40-year high of 7.2% later today. Yes, that is a big number, but it has been well advertised and markets have already fully prices in 4 hikers this year with some expectations of five. Therefore, one has to question how long markets will be scared of the headline number that has been rising for multiple months in a very public way. And more to the point, a number that is already losing momentum. So if inflation undershoots already high expectations it may come as more of a surprise to traders. And it may take a much hotter inflation print than expected to see current trends continue.
EUR/GBP turns higher, more to follow?
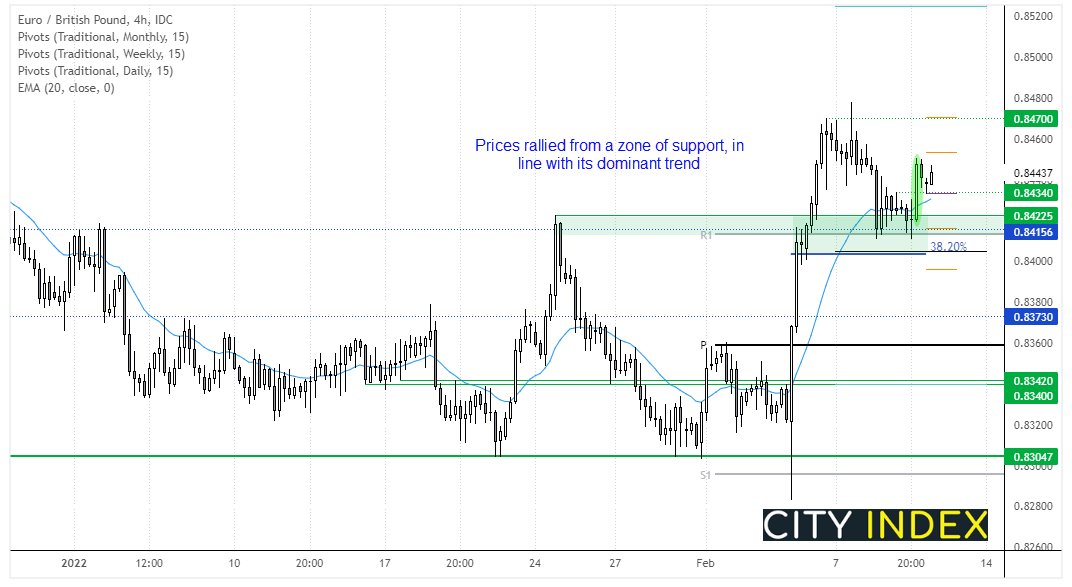

In yesterday’s report we noted that prices were coiling tightly within a triangle on the hourly chart and that could be indicative of pending volatility. It did not disappoint. Whilst the triangle breakout was initially lower, two of the several support levels in close proximity marked the low and momentum has turned higher. Prices have pulled back on the four-hour chart to the 0.8434 high and we’re simply looking for prices to hold above the low of the breakout candle before moving back towards 0.8470.
Up Next (Times in GMT)
How to trade with City Index
You can easily trade with City Index by using these four easy steps:
- Open an account, or log in if you’re already a customer
• Open an account in the UK
• Open an account in Australia
• Open an account in Singapore
- Search for the company you want to trade in our award-winning platform
- Choose your position and size, and your stop and limit levels
- Place the trade
How to trade with FOREX.com
Follow these easy steps to start trading with FOREX.com today:
- Open a Forex.com account, or log in if you’re already a customer.
- Search for the pair you want to trade in our award-winning platform.
- Choose your position and size, and your stop and limit levels.
- Place the trade.


The complete CFD trading experience
Award-winning platforms, competitive spreads, low commissions and dedicated support.
We live and breathe the markets and are dedicated to helping traders realise their ambitions as we continue to set the industry bar.
Economic calendar
Web Trader platform
Our sophisticated web-based platform is packed with features.
Related articles
USD/CAD shooting star puts September surge on notice
USD/CAD has printed a clear bearish reversal pattern after an extraordinary September surge, but confirmation may depend heavily on how US Treasury yields react to Friday’s payrolls report.

USD/MXN Analysis: Is Super Peso Starting to Fade?
Over recent trading sessions, the Mexican peso has continued to show signs of weakness against the U.S. dollar. This can already be seen in USD/MXN, which has gained more than 1.7% over the last three sessions, highlighting sustained buying pressure in favor of the dollar in the short term.


Canadian Dollar Analysis: USD/CAD Returns to July Highs Ahead of NFP
The Canadian dollar continues to face one of its most challenging environments in recent months when it comes to maintaining strength against the U.S. dollar. The weakness of the Canadian currency is clearly reflected in USD/CAD, which has now recorded nine consecutive bullish sessions and gained more than 1.7% during that period.
StoneX Europe Ltd may make third party material available on this website which may contain information included but not limited to the conditions of financial markets. The material is for information purposes only and does not contain, and should not be construed as containing, investment advice and/or investment recommendation and/or an investment research and/or an offer of or solicitation for any transactions in financial instruments; any decision to enter into a specific transaction shall be made by the client following an assessment by him/her of their situation.
StoneX Europe Ltd makes no representation or warranty and assumes no liability as to the accuracy or completeness of the information provided, nor any loss arising from any investment based on a recommendation, forecast or other information supplied. You should always seek independent advice as to your suitability to speculate in any related markets and your ability to assume the associated risks, if you are at all unsure. We are not under any obligation to update any such material. Any opinion made may be personal to the author and may not reflect the opinion of StoneX Europe Ltd.