



European Open: The USD is back on the ropes as ISM renews recession fears
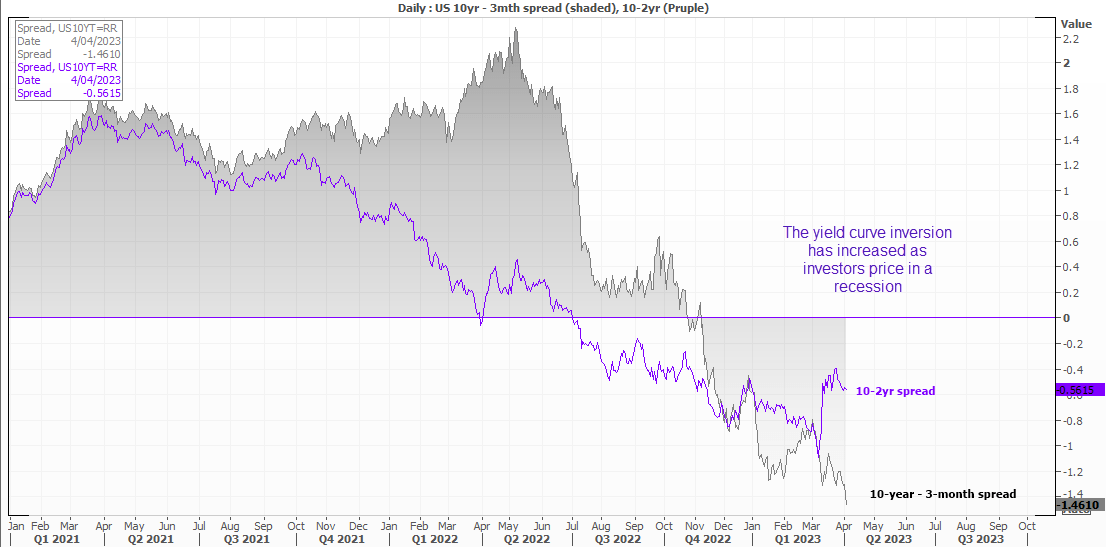
Weak PMI and ISM data has renewed concerns of a US recession, which saw the 10-year – 3-month hit its most negative level since the 80’s.
Share this:

Asian Indices:
- Australia's ASX 200 index fell by -2.9 points (-0.04%) and currently trades at 7,220.10
- Japan's Nikkei 225 index has risen by 72.82 points (0.26%) and currently trades at 28,260.97
- Hong Kong's Hang Seng index has fallen by -110.44 points (-0.54%) and currently trades at 20,298.74
- China's A50 Index has fallen by -51.5 points (-0.39%) and currently trades at 13,163.42
UK and Europe:
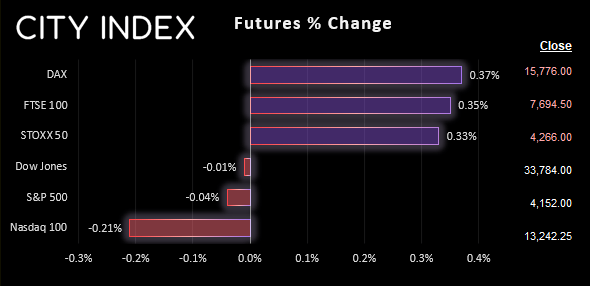
- UK's FTSE 100 futures are currently up 26 points (0.34%), the cash market is currently estimated to open at 7,699.00
- Euro STOXX 50 futures are currently up 14 points (0.33%), the cash market is currently estimated to open at 4,325.05
- Germany's DAX futures are currently up 56 points (0.36%), the cash market is currently estimated to open at 15,636.92
US Futures:
- DJI futures are currently down -3 points (-0.01%)
- S&P 500 futures are currently down -2 points (-0.05%)
- Nasdaq 100 futures are currently down -27.75 points (-0.21%)
- Currencies remain in tight ranges leading up to the RBA’s cash rate decision, whilst equity markets across the APAC region were mixed
- The US dollar was technically the strongest major, but only due to a minor retracement against yesterday’s losses
- The dollar is on the back foot as yesterday’s PMI and ISM reports point towards a US recession, which saw gold catch a bid and the yield curve invert further
- A bullish engulfing candle formed on gold’s daily chart, to mirror moves in the US dollar
- BOE Chief Economist Huw Pill speaks at the International Centre for Monetary and Banking Studies at 15:30 GMT+1 on ‘Inflation, persistence & Monetary policy’
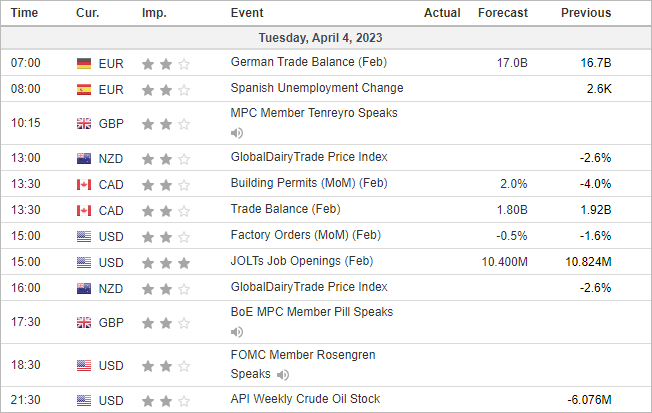
- There’s no major economic data scheduled, although a sudden rise in JOLTS job openings accompanied with notably weak factory orders could weigh further on the US dollar
Concerns of a recession weighed on the dollar yesterday
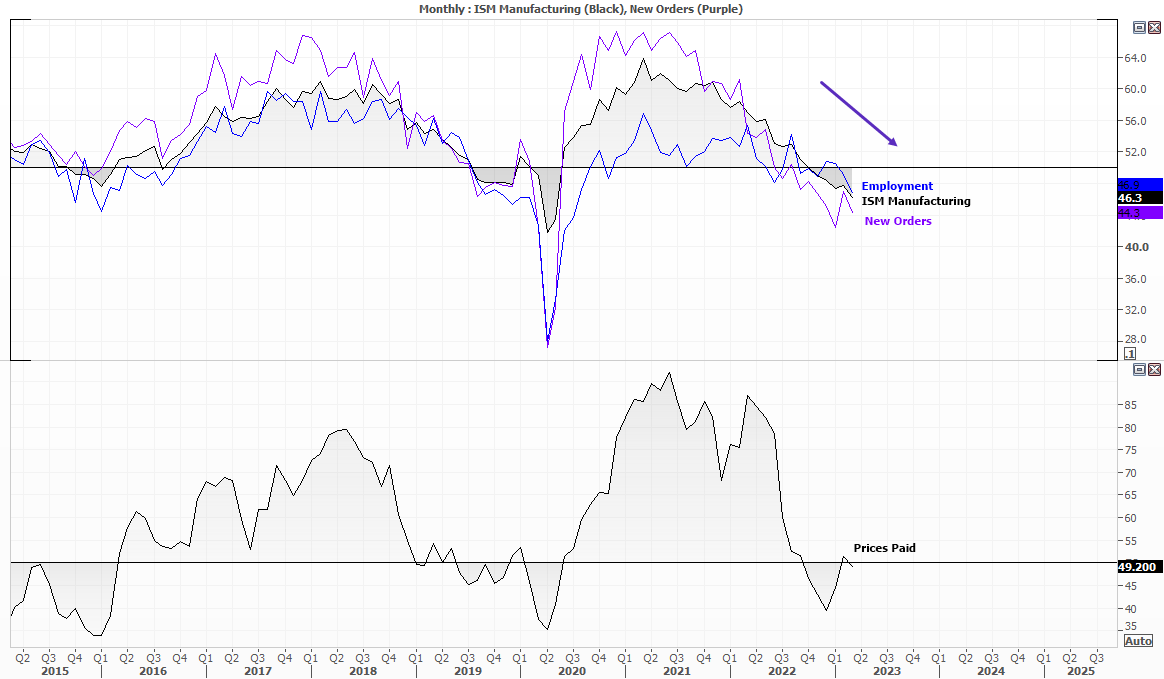
PMI data for March has so far disappointed, with a slew of contractions or weaker-than-expected prints appearing across APAC, Europe and the US. China’s Caixin PMI (which looks at SME’s) was flat at 50, key exporter South Korea’s contracted at a faster pace (slower global demand), although contractions for US, Australia, Japan, Germany and the eurozone were at a slower pace according to S&P global data. Most notably, headline ISM manufacturing contracted at its fastest pace since the pandemic, nine of its 10 sub indices contracting which left only the ‘prices pain’ index to expand.
Ultimately this has led to renewed concerns of a US recession, which saw the 10-year – 3-month hit its most negative level since the 80’s (according to Reuters data) as the 3-month yield headed back towards 5% whilst the 10-year pulled back to 3.42%.
And if investors fear a recession (which itself is deflationary) it means the Fed face less pressure to hike rates. Whilst the Fed fund futures currently imply a 57.2% chance of a final 25bp hike, the US dollar has faced selling pressure and has fallen against all of its major FX peers this week.
- The US dollar index formed a bearish outside / engulfing day and closed at a 41-day low
- USD/CAD fell for a sixth day to a 32-day low
- A bearish outside / engulfing day formed on USD/JPY
- A bullish engulfing candle formed on gold’s daily chart
- Oil prices held onto yesterday’s opening-gap gains of ~7%, although so far is struggling to rally above the 82 – 82.70 resistance zone
USD/JPY daily chart:
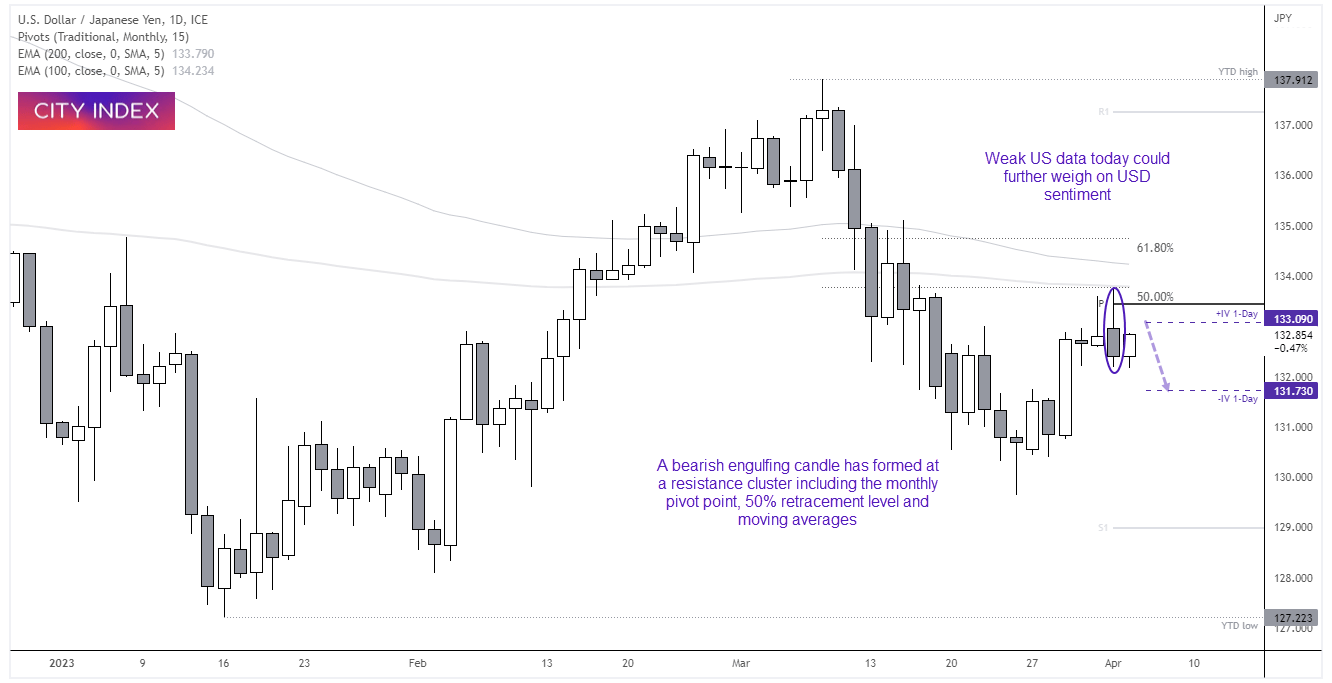
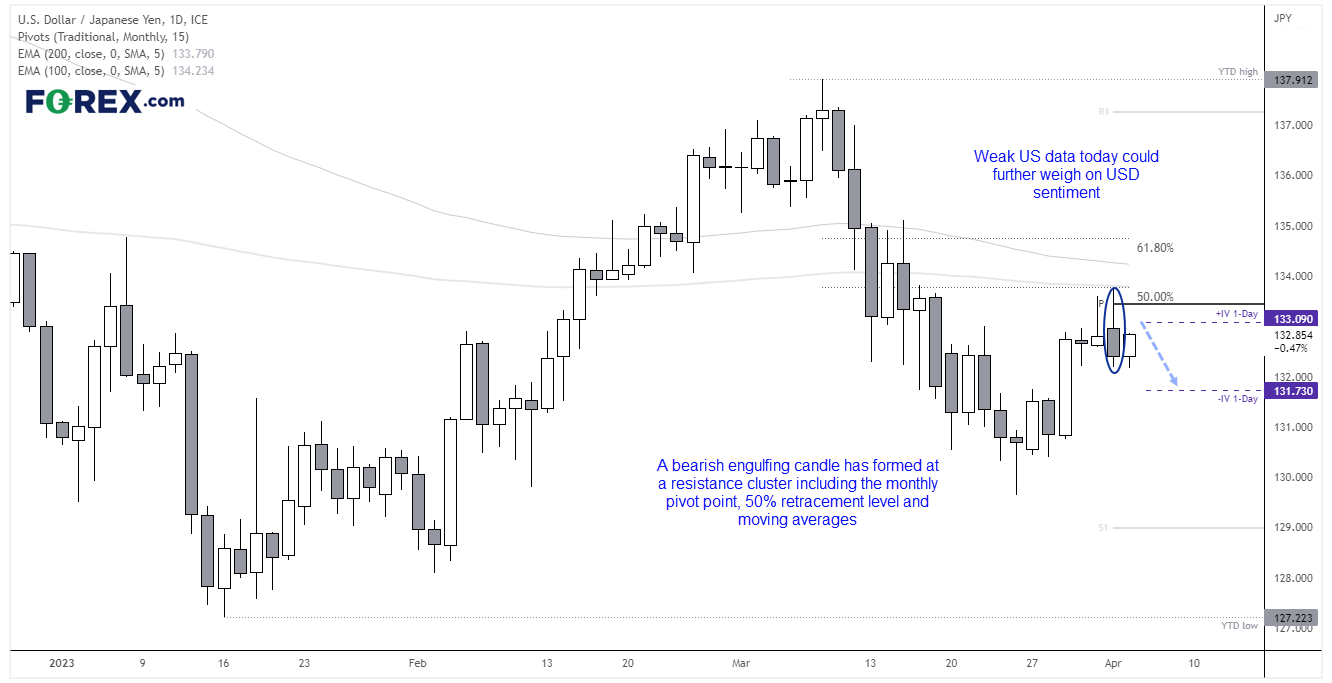
A bearish engulfing / outside formed on USD/JPY at a resistance cluster which includes the monthly pivot point, 50% retracement level and 100-day EMA. Prices are retracing higher within yesterday’s range (and forming a rally from a 4hour bullish trendline), but if we see weak employment and factory data then bears could be tempted to fade into resistance levels and for a move back towards 132. Note that the downside band for 1-day implied volatility is just below 132, which makes it a viable target for bears over the neat 24-hours if sentiment towards the dollar remains weak. A break above yesterday’s high invalidates the bearish bias.
Economic events up next (Times in GMT+1)
-- Written by Matt Simpson
Follow Matt on Twitter @cLeverEdge
How to trade with City Index
You can trade with City Index by following these four easy steps:
- Open an account, or log in if you’re already a customer
• Open an account in the UK
• Open an account in Australia
• Open an account in Singapore
- Search for the market you want to trade in our award-winning platform
- Choose your position and size, and your stop and limit levels
- Place the trade
Related tags:


The complete CFD trading experience
Award-winning platforms, competitive spreads, low commissions and dedicated support.
We live and breathe the markets and are dedicated to helping traders realise their ambitions as we continue to set the industry bar.
Economic calendar
Web Trader platform
Our sophisticated web-based platform is packed with features.
Related articles

AUD/USD, NZD/USD face explosive CPI, RBNZ doubleheader
Aussie and Kiwi have gone remarkably quiet ahead of Australian inflation data and RBNZ decision. With substantial tightening priced and both events capable of generating major FX swings, Wednesday could deliver a volatility eruption in the antipodes.


USD/JPY bulls back in business as AI trade roars back
The AI investment boom rolls on, with Anthropic and Meta helping revive enthusiasm across Wall Street. USD/JPY has responded with a bullish reversal pattern, putting its former trading range back in focus ahead of major central bank decisions and technology earnings.

Fed, DXY, EUR/USD, GBP/USD, USD/CAD, Gold Weekly Technical Outlook 10 26 2026
Sr. Technical Strategist Michael Boutros highlights the levels that matter on the USD Majors, commodities, and equity indices charts this week.

StoneX Europe Ltd may make third party material available on this website which may contain information included but not limited to the conditions of financial markets. The material is for information purposes only and does not contain, and should not be construed as containing, investment advice and/or investment recommendation and/or an investment research and/or an offer of or solicitation for any transactions in financial instruments; any decision to enter into a specific transaction shall be made by the client following an assessment by him/her of their situation.
StoneX Europe Ltd makes no representation or warranty and assumes no liability as to the accuracy or completeness of the information provided, nor any loss arising from any investment based on a recommendation, forecast or other information supplied. You should always seek independent advice as to your suitability to speculate in any related markets and your ability to assume the associated risks, if you are at all unsure. We are not under any obligation to update any such material. Any opinion made may be personal to the author and may not reflect the opinion of StoneX Europe Ltd.