



Facebook parent Meta plunges 20% as earnings forecast miss the Mark
Facebook parent, Meta Platforms Inc, has joined the likes of Peloton, Tesla, Netflix, Paypal and Spotify to be punished by investors this reporting season for lackluster earnings and frothy valuations.
Share this:

Meta is investing heavily in the “metaverse,” a virtual world where the internet is bought to life in 3D. However, Meta relies on adverting dollars and new users to drive revenue in the meantime.
A combination of higher costs, increased competition, weaker revenue forecasts, and no growth in new users in the fourth quarter, enough to panic investors.
The share price of Meta is trading over 20% lower, near $250 in the aftermarket, indicating that over $150 billion will be wiped from the company’s market capitalization when the stock resumes full trading.
The earnings miss compounds the woes of Meta shareholders, who have seen the stock price fall from record highs in recent months as the company fights regulatory battles on several fronts. And as Chief Executive, Mark Zuckerberg leads the company into the unchartered waters of the Metaverse.
Furthermore, the tech sector has fallen out of favour in recent months as higher interest rates undermine the value of future cash flows from growth stocks. This is best illustrated by a 17% fall in the tech-heavy Nasdaq Index in the first four weeks of 2022.
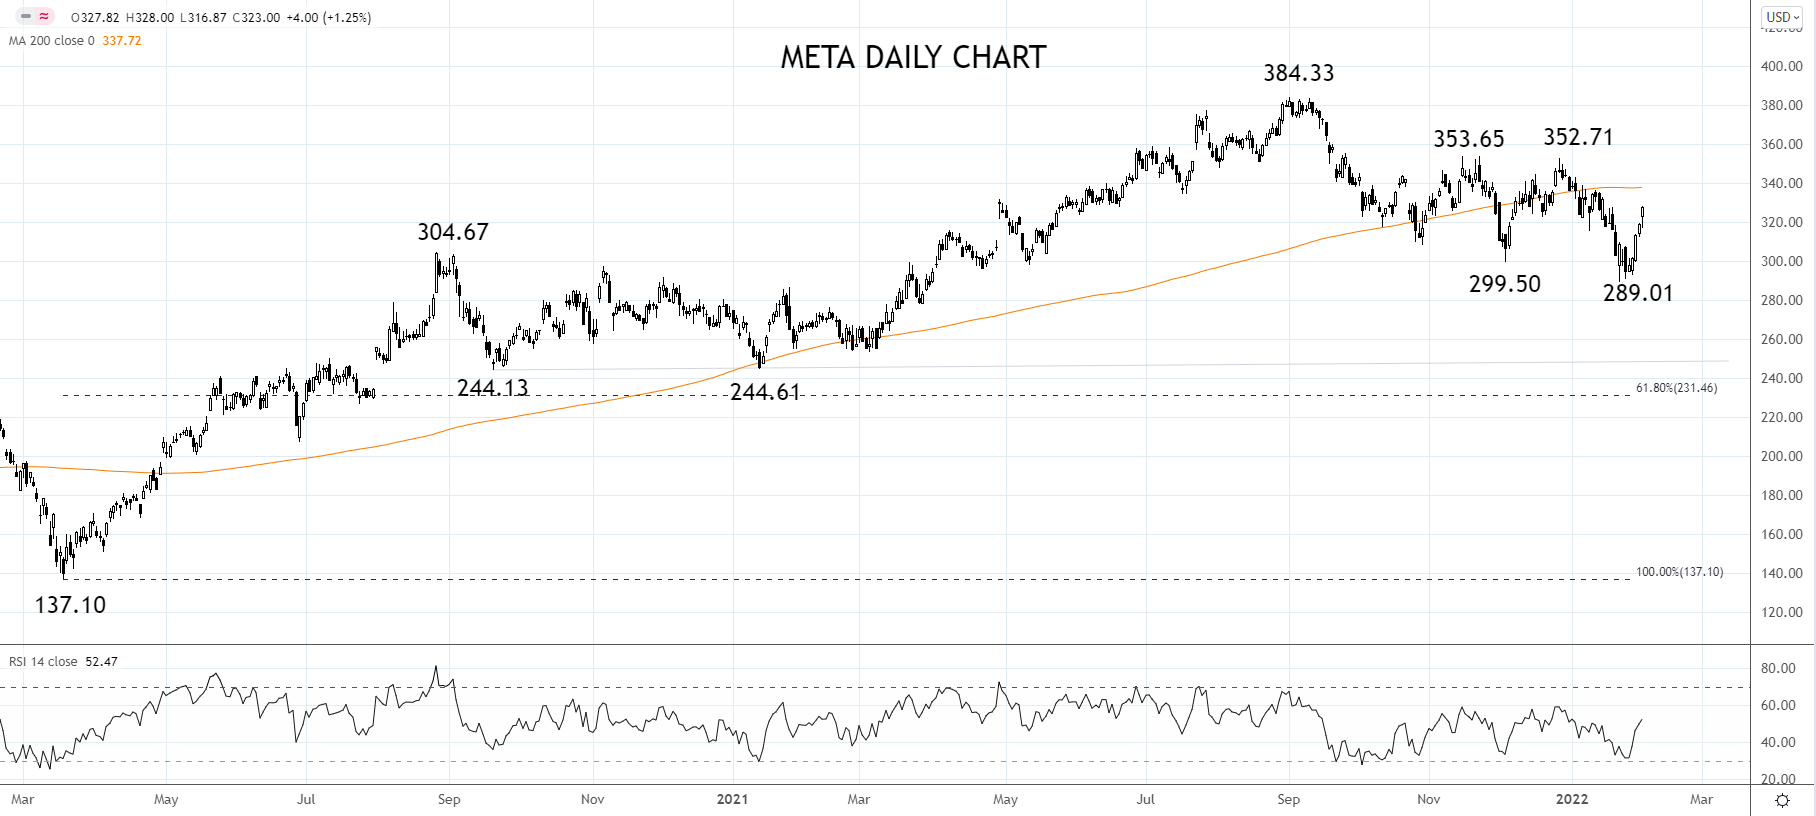
Meta Share Price Chart
Presuming the share price of Meta opens tonight near where it is trading currently (at $250), it will be trading below a layer of support now resistance at $290/300. The share price needs to rebound above this level to avoid a deeper retracement.
On the downside, support is viewed between $244/$231, which encapsulates horizontal support, and the 61.% Fibonacci retracement from the Covid $137.10 low to the September 2021, $384.33 high.
Source Tradingview. The figures stated areas of February 3rd, 2022. Past performance is not a reliable indicator of future performance. This report does not contain and is not to be taken as containing any financial product advice or financial product recommendation
How to trade with City Index
You can trade with City Index by following these four easy steps:
- Open an account, or log in if you’re already a customer
• Open an account in the UK
• Open an account in Australia
• Open an account in Singapore
- Search for the company you want to trade in our award-winning platform
- Choose your position and size, and your stop and limit levels
- Place the trade
Meta is investing heavily in the “metaverse,” a virtual world where the internet is bought to life in 3D. However, Meta relies on adverting dollars and new users to drive revenue in the meantime.
A combination of higher costs, increased competition, weaker revenue forecasts, and no growth in new users in the fourth quarter, enough to panic investors.
The share price of Meta is trading over 20% lower, near $250 in the aftermarket, indicating that over $150 billion will be wiped from the company’s market capitalization when the stock resumes full trading.
The earnings miss compounds the woes of Meta shareholders, who have seen the stock price fall from record highs in recent months as the company fights regulatory battles on several fronts. And as Chief Executive, Mark Zuckerberg leads the company into the unchartered waters of the Metaverse.
Furthermore, the tech sector has fallen out of favour in recent months as higher interest rates undermine the value of future cash flows from growth stocks. This is best illustrated by a 17% fall in the tech-heavy Nasdaq Index in the first four weeks of 2022.
Meta Share Price Chart
Presuming the share price of Meta opens tonight near where it is trading currently (at $250), it will be trading below a layer of support now resistance at $290/300. The share price needs to rebound above this level to avoid a deeper retracement.
On the downside, support is viewed between $244/$231, which encapsulates horizontal support, and the 61.% Fibonacci retracement from the Covid $137.10 low to the September 2021, $384.33 high.
Source Tradingview. The figures stated areas of February 3rd, 2022. Past performance is not a reliable indicator of future performance. This report does not contain and is not to be taken as containing any financial product advice or financial product recommendation
- Open a Forex.com account, or log in if you’re already a customer.
- Search for the pair you want to trade in our award-winning platform.
- Choose your position and size, and your stop and limit levels.
- Place the trade.
Related tags:
Latest market news




The complete CFD trading experience
Award-winning platforms, competitive spreads, low commissions and dedicated support.
We live and breathe the markets and are dedicated to helping traders realise their ambitions as we continue to set the industry bar.
Economic calendar
Web Trader platform
Our sophisticated web-based platform is packed with features.
Related articles

Nasdaq 100 Forecast: “Magnificent Seven” Q4 2025 Earnings Preview
For the Magnificent Seven, This earnings season is no longer about whether AI is real, but whether the AI boom is entering a phase where these real world constraints will weigh on growth.


Nasdaq 100 Breaks Out Into Bull Market, Tops Wall Street Rally
Nasdaq 100 futures erased a 75-day bear market in just 23 sessions. Is this the start of a new bullish cycle—or just another bear market bounce?


DAX Rises on €500B Stimulus; Fed & Nvidia in Focus for this week
DAX rallies as Germany moves forward with a €500B fiscal package, boosting investor confidence. US consumer sentiment plunges, inflation expectations rise, and Fed set to hold rates at 4.5% this week. Nvidia’s GTC event could shake up AI & semiconductor stocks, while oil hits two-week highs after US strikes in Yemen. Bitcoin weakens, while gold nears record highs on safe-haven demand. Volatility ahead as earnings & macro risks loom.

StoneX Europe Ltd may make third party material available on this website which may contain information included but not limited to the conditions of financial markets. The material is for information purposes only and does not contain, and should not be construed as containing, investment advice and/or investment recommendation and/or an investment research and/or an offer of or solicitation for any transactions in financial instruments; any decision to enter into a specific transaction shall be made by the client following an assessment by him/her of their situation.
StoneX Europe Ltd makes no representation or warranty and assumes no liability as to the accuracy or completeness of the information provided, nor any loss arising from any investment based on a recommendation, forecast or other information supplied. You should always seek independent advice as to your suitability to speculate in any related markets and your ability to assume the associated risks, if you are at all unsure. We are not under any obligation to update any such material. Any opinion made may be personal to the author and may not reflect the opinion of StoneX Europe Ltd.