



GBP/AUD Slumps to 13-Year Low as RBA–BoE Divergence Widens
GBP/AUD hits a 13-year low as RBA hawkishness and BoE easing expectations drive policy divergence and sterling weakness.
Share this:
GBP/AUD has plunged to a 13-year low as widening monetary policy divergence between the Reserve Bank of Australia (RBA) and the Bank of England (BoE) combines with rising UK political uncertainty.
The cross is on track for its worst monthly performance since September 2023, with bearish momentum accelerating as traders position for further divergence in rates and growth expectations. With technical levels breaking across multiple timeframes, the focus now shifts to how much further the downside could extend.
View related analysis:
View related analysis:
GBP/AUD Slumps to 13-Year Low on RBA–BoE Policy Divergence
Diverging RBA and BoE Policy, Political Risk Weigh on GBP/AUD
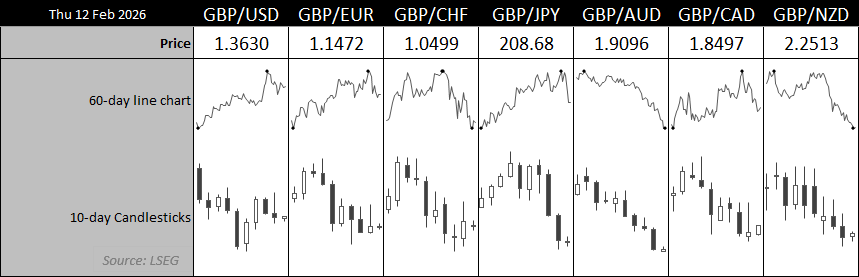
We’re not even halfway through a short month, and GBP/AUD is close to surpassing January as the worst month for the pair since September 2023. Traders have been handed the kind of divergent theme FX markets thrive on: a classic mix of diverging monetary policy expectations and mounting political uncertainty.
- The Reserve Bank of Australia (RBA) delivered a hawkish 25bp hike. While the move itself was widely expected, the tone of the statement and upgraded forecasts provided the real upside surprise for Australian dollar bulls.
- The Bank of England (BoE) held rates as expected, but the vote split was far tighter than the anticipated 7–2 in favour of a hold. Instead, five MPC members voted to hold and four to cut. The Bank also signalled that further rate reductions are likely.
- On the political front, UK PM Keir Starmer is under pressure amid fallout linked to the Epstein files. While not directly implicated, scrutiny around his decision to appoint Mandelson — and whether he was aware of prior controversies — has raised questions over judgement and governance. Even without concrete findings, political uncertainty is adding to sterling’s headwinds.
Source: LSEG
GBP/AUD Hits 13-Year Low as Bearish Momentum Accelerates
This ideal mix of bearish drivers for GBP/AUD has pushed the cross to a 156-month low, with momentum clearly accelerating. The key question now is how much further it can fall.
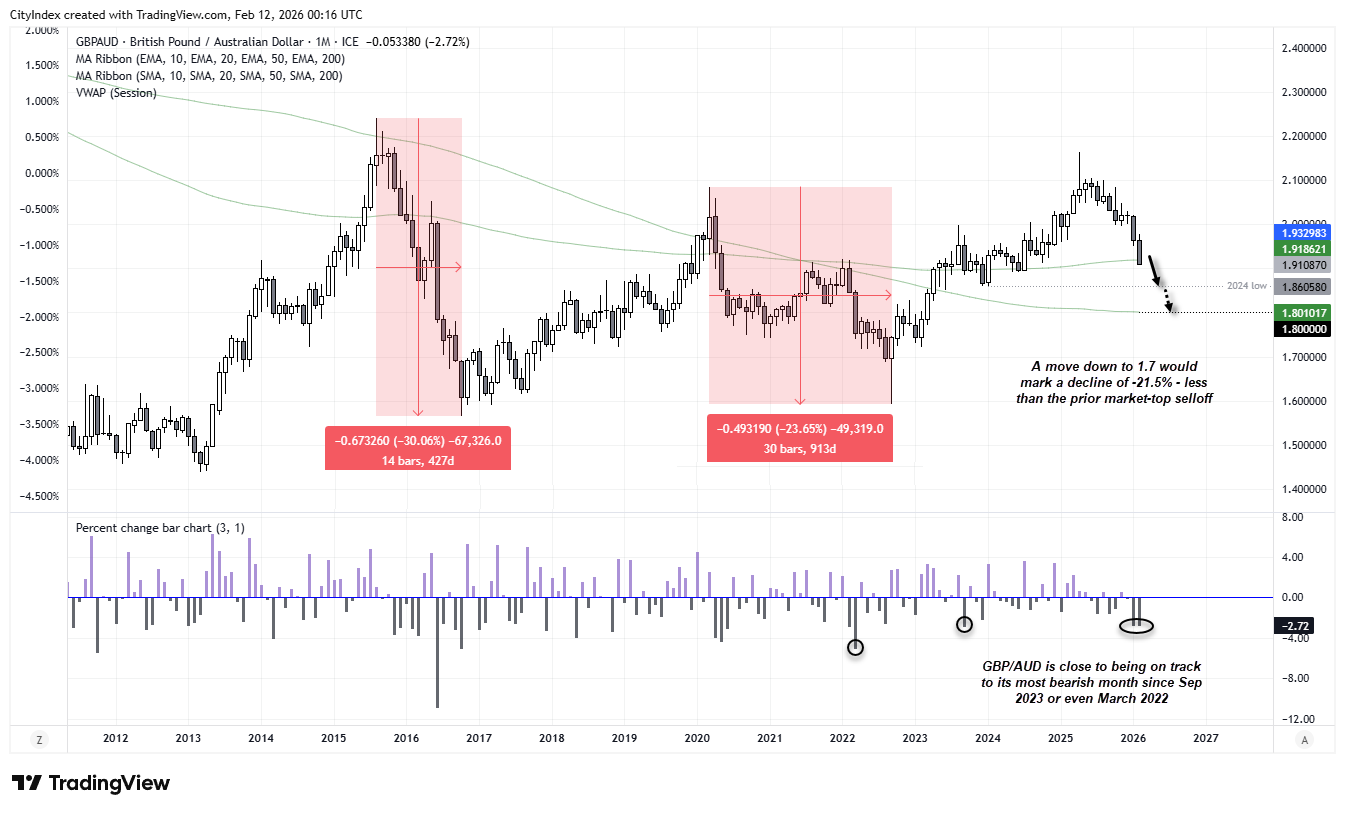
If history is any guide, there may still be room to the downside. GBP/AUD has declined just 11.7% from its recent peak — less than half the magnitude of the previous two major tops.
- March 2020 – September 2022: -23.7%
- August 2015 – October 2016: -30.1%
- April 2025 – Present: -11.7%
In other words, the current drawdown remains modest relative to prior cyclical declines, which suggests the move could extend further if the macro and political divergence persists.
Source: TradingView / ICE
GBP/AUD Tests 200-Month EMA as Bears Eye 1.80 Handle
The monthly chart shows GBP/AUD testing a break below its 200-month EMA (1.9186). While that could spark a near-term bounce, momentum suggests bears are targeting the 2024 low at 1.8605, or potentially the 200-month SMA near the 1.80 handle.
For context, a move down to 1.80 would amount to a 16.8% decline from the recent high. Even a drop to 1.70 would still fall short of the previous major market-top selloff of 23.7%.


GBP/AUD Technical Analysis: British Pound vs Australian Dollar
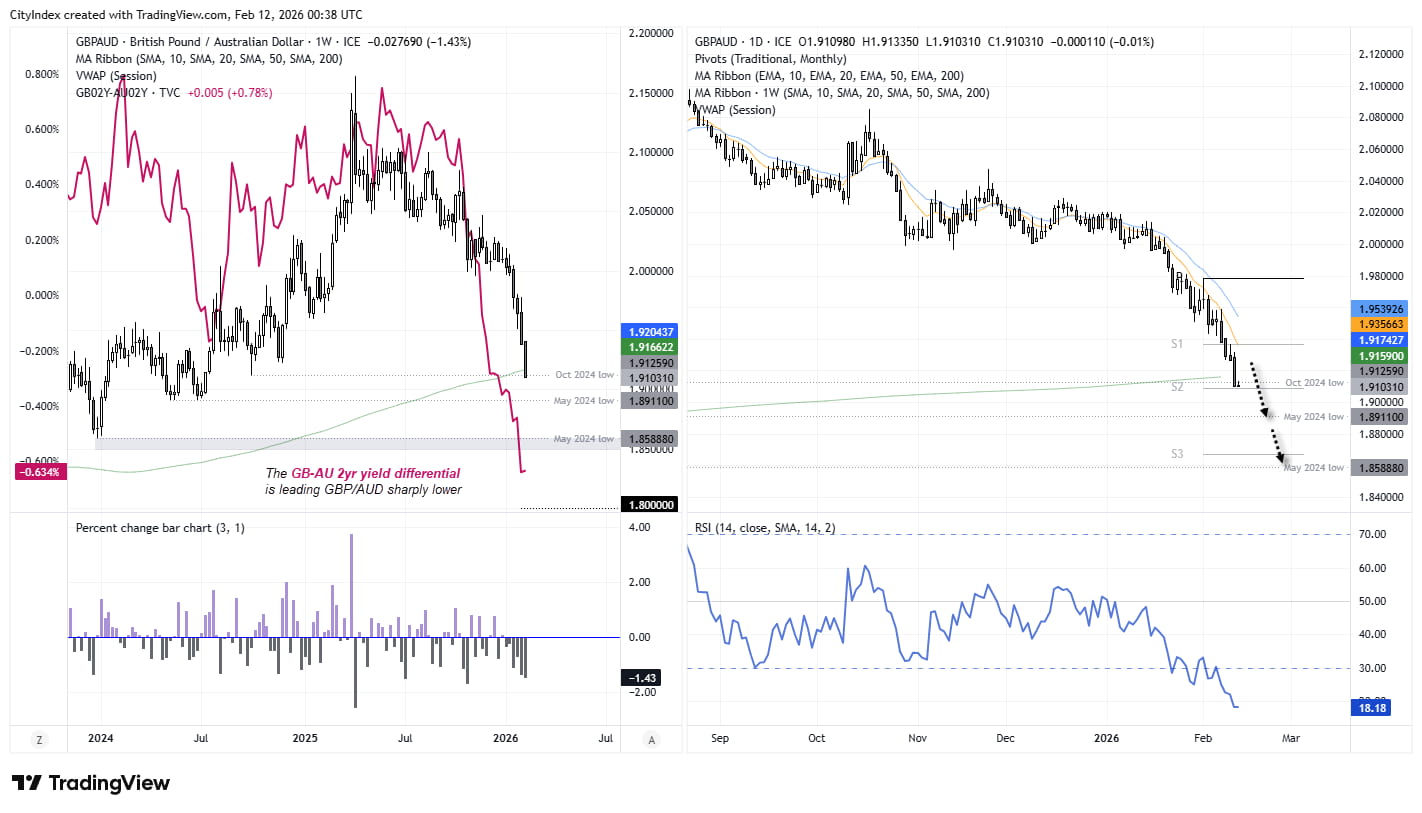
The cross has now broken below its 200-week SMA — a technically significant level. With price hovering around the October 2024 low, bears should be alert to the risk of near-term two-way volatility before the broader downtrend potentially resumes.
On the daily chart, price is stretched well below the 10- and 20-day EMAs, while RSI (14) is deeply oversold. These are not precise timing tools, but they do flag the risk of interim mean reversion.
That said, with UK political uncertainty and BoE easing expectations weighing on sterling — and RBA policy expectations underpinning the Australian dollar — GBP/AUD remains a cross to keep on bearish watchlists unless a material catalyst emerges to reverse the trend. The GB–AU 2-year yield differential continues to lead the move lower.
Source: TradingView / ICE
View the full economic calendar
View the full economic calendar
-- Written by Matt Simpson
Follow Matt on Twitter @cLeverEdge
How to trade with City Index
You can trade with City Index by following these four easy steps:
- Open an account, or log in if you’re already a customer
• Open an account in the UK
• Open an account in Australia
• Open an account in Singapore
- Search for the market you want to trade in our award-winning platform
- Choose your position and size, and your stop and limit levels
- Place the trade
Related tags:


The complete CFD trading experience
Award-winning platforms, competitive spreads, low commissions and dedicated support.
We live and breathe the markets and are dedicated to helping traders realise their ambitions as we continue to set the industry bar.
Economic calendar
Web Trader platform
Our sophisticated web-based platform is packed with features.
Related articles

ASX 200 Outlook: A Rates Trade Disguised as a Stock Market?
Australian bond futures have exhibited a far stronger relationship with the ASX 200 than Wall Street over recent months. Now both markets are displaying remarkably similar price structures.


AUD/USD Bulls Fight Back After Australian Jobs Shock
AUD/USD has been hit by another ugly Australian employment report, sending RBA rate hike expectations sharply lower. Yet the relationships driving the currency have shifted since quarter-end, and improving risk appetite could provide the fuel for a recovery.

USD/JPY Update: Can the Japanese Yen Sustain Its Recovery?
Short-term price action around the Japanese yen has started to show some relative improvement over recent sessions. This can be seen in the recent performance of USD/JPY, which has now recorded three consecutive daily declines in favor of the Japanese currency, resulting in a depreciation of roughly 0.35% over the period.

StoneX Europe Ltd may make third party material available on this website which may contain information included but not limited to the conditions of financial markets. The material is for information purposes only and does not contain, and should not be construed as containing, investment advice and/or investment recommendation and/or an investment research and/or an offer of or solicitation for any transactions in financial instruments; any decision to enter into a specific transaction shall be made by the client following an assessment by him/her of their situation.
StoneX Europe Ltd makes no representation or warranty and assumes no liability as to the accuracy or completeness of the information provided, nor any loss arising from any investment based on a recommendation, forecast or other information supplied. You should always seek independent advice as to your suitability to speculate in any related markets and your ability to assume the associated risks, if you are at all unsure. We are not under any obligation to update any such material. Any opinion made may be personal to the author and may not reflect the opinion of StoneX Europe Ltd.