


GBP/USD approaches breaking point as US yields surge
A historic repricing of US interest rate expectations has propelled the dollar higher, leaving GBP/USD testing a crucial support level ahead of UK GDP.
Share this:

- US two-year yields post mammoth surge
- Dollar rally ranks among 2026's largest
- Panel appearance from NY Fed President John Williams eyed
- GBP/USD tests 1.3275 ahead of UK GDP
The US dollar has surged in recent days on the back of a dramatic hawkish repricing at the front end of the US interest rate curve, fuelled by hot inflation, strong labour market data and hawkish commentary from influential Federal Reserve officials.
The move has dragged GBP/USD back towards 1.3275, a level that has repeatedly acted as support and resistance over recent months, providing an appealing opportunity to build trade setups depending on how the price responds heading into Thursday's UK GDP report.
US economic exceptionalism makes a comeback
The US dollar's latest resurgence, taking the US Dollar Index (DXY) to its highest level since April 2025, has coincided with a raft of stronger-than-expected economic data. October nonfarm payrolls surged by 165,000, comfortably exceeding forecasts, while the unemployment rate fell to 4.1%. That was followed earlier this week by yet another hot inflation report, confirming that underlying price pressures remain sticky and well above the Fed's 2% target.
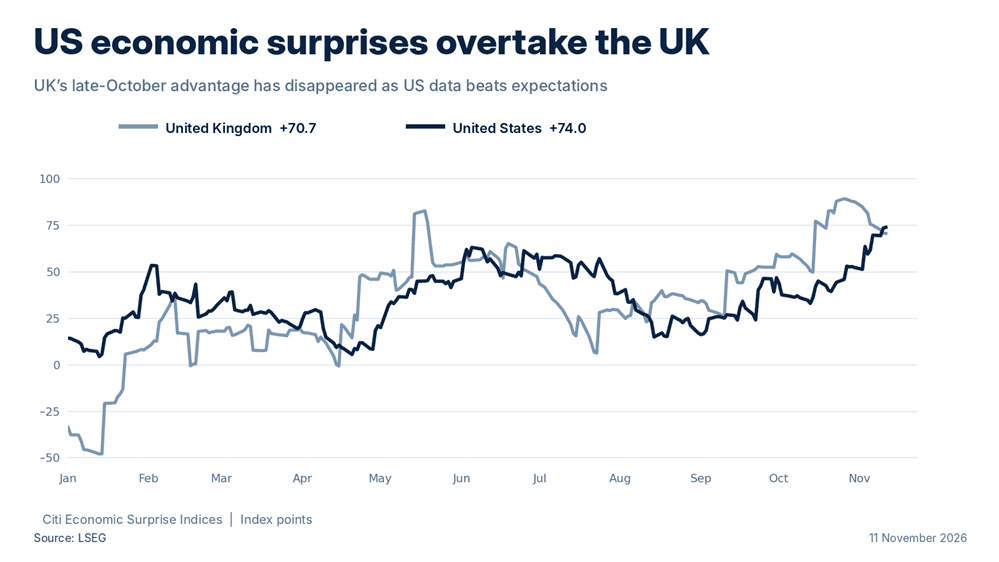
Source: LSEG
These upside surprises are symptomatic of a broader improvement in US economic data relative to expectations, as reflected in Citi's Economic Surprise Indices above. These measure whether economic releases are beating or missing consensus forecasts, with positive readings indicating that data is generally exceeding expectations. While UK economic data has also consistently surprised to the upside in recent months, what's notable is how sharply the US index has closed the gap, overtaking its UK counterpart in recent sessions after trailing by more than 35 points at the end of October.
US rate repricing ranks among the largest in decades
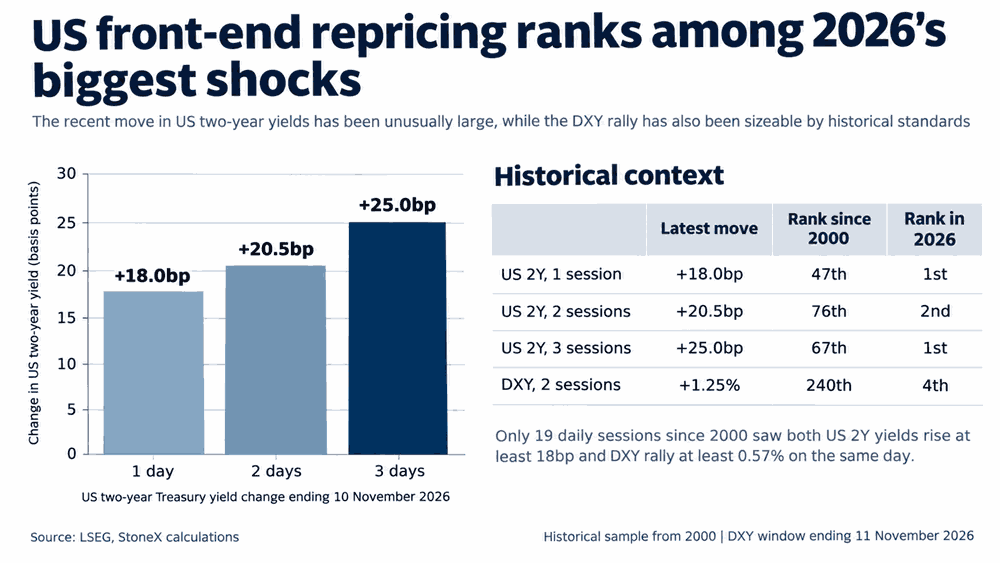
Source: LSEG
In response to the latest bout of US economic exceptionalism, the move at the front end of the US yield curve has been substantial. Two-year Treasury yields surged 25 basis points over the three sessions ending Tuesday, the largest increase over a comparable period in 2026 and one that ranks among the biggest 1% of all observations since 2000. The response of the dollar has been equally eye-watering, with DXY surging 1.25% over two sessions, the fourth-largest increase over a comparable period this year.
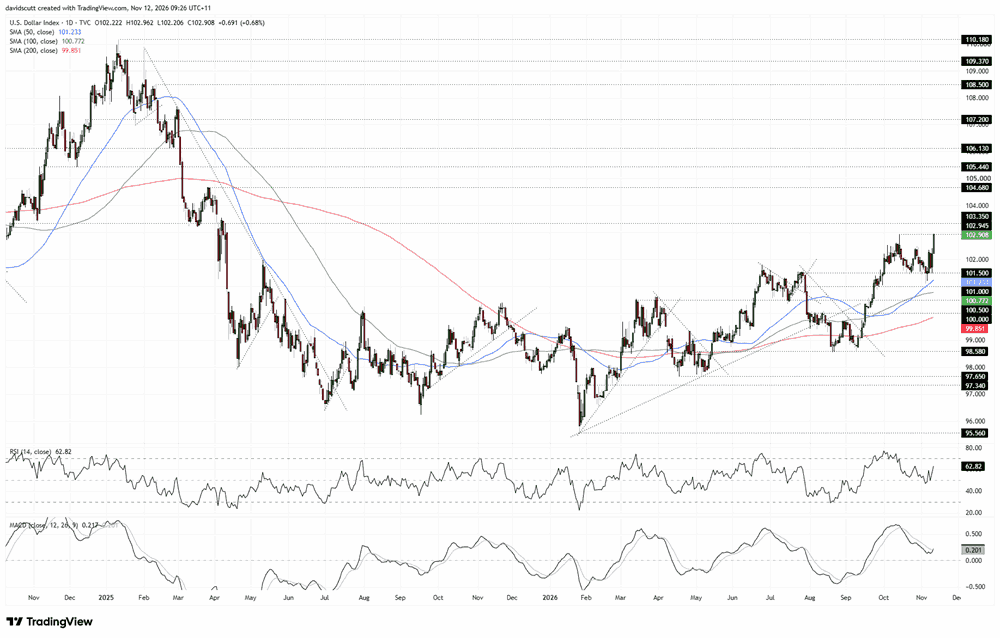
Source: TradingView
The technical picture also remains supportive for the dollar. Having threatened to break beneath support at 101.50 earlier this month, DXY has rebounded sharply and is now testing 102.945, the swing high set in October. A break above that level would bring 103.35 into view, followed by 104.68. The index is also trading above its 50, 100 and 200-day moving averages, all of which are sloping higher, while RSI (14) is pushing higher and MACD has turned up again, reinforcing the bullish bias.
Fed repricing puts sterling under pressure
The repricing has been even more violent in one-year US OIS, which reflects market expectations for the future path of the Fed funds rate. Since last Thursday, US one-year OIS rates have surged 31.1 basis points, compared with just 12.8 basis points in the UK. That has narrowed the differential between the two nations by 18.3 basis points, coinciding with a 1.32% decline in GBP/USD.
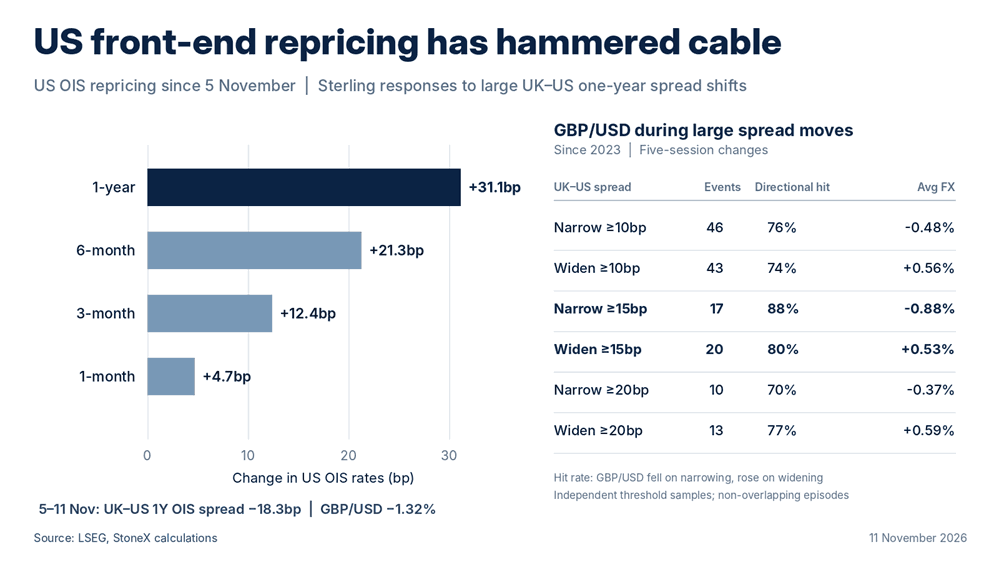
Source: LSEG
Historical analysis suggests sterling is particularly sensitive to large shifts in relative policy expectations, especially when they move in favour of the United States. Since 2023, GBP/USD has fallen on 15 of 17 occasions (88%) when the UK–US one-year OIS spread narrowed by at least 15 basis points over five sessions, averaging a decline of 0.88%. When the differential widened by the same magnitude, sterling rose in 16 of 20 observations (80%), although the average gain was smaller at 0.53%.
The hawkish shift in the US rate outlook has been reinforced by influential Fed officials, including Christopher Waller on Tuesday, who raised the possibility of a 50-basis-point rate hike at the Fed's December meeting should core CPI increase by 0.3% or more, exactly what Tuesday's inflation report delivered. Attention now turns to New York Fed President John Williams, who is scheduled to participate in a panel discussion later Thursday. Given he and Waller were instrumental in pushing back against market pricing that favoured an October rate hike, any similarly hawkish remarks from Williams could encourage further repricing of the Fed outlook, providing even stronger tailwinds for the US dollar should that eventuate.
UK GDP puts December BoE rate hike expectations in focus
While US economic data and central bank commentary have been the dominant influences on GBP/USD recently, attention will briefly turn to the UK on Thursday with the release of September-quarter GDP. Economists expect a punchy 0.7% quarterly increase, lifting annual growth to 1.9%, assuming no revisions. As in other developed economies, investment associated with the AI buildout has helped support UK economic activity.
For sterling, the key question is whether the data will be strong enough to keep expectations for another Bank of England rate hike in December firmly in play following last week's hawkish increase. Any signs of weakness could cast doubt on whether further tightening is warranted, potentially adding to the pressure on GBP/USD. Conversely, another strong reading could reinforce expectations for a follow-up hike, providing some much-needed support for the pound.
GBP/USD: 1.3275 the line in the sand
Source: TradingView
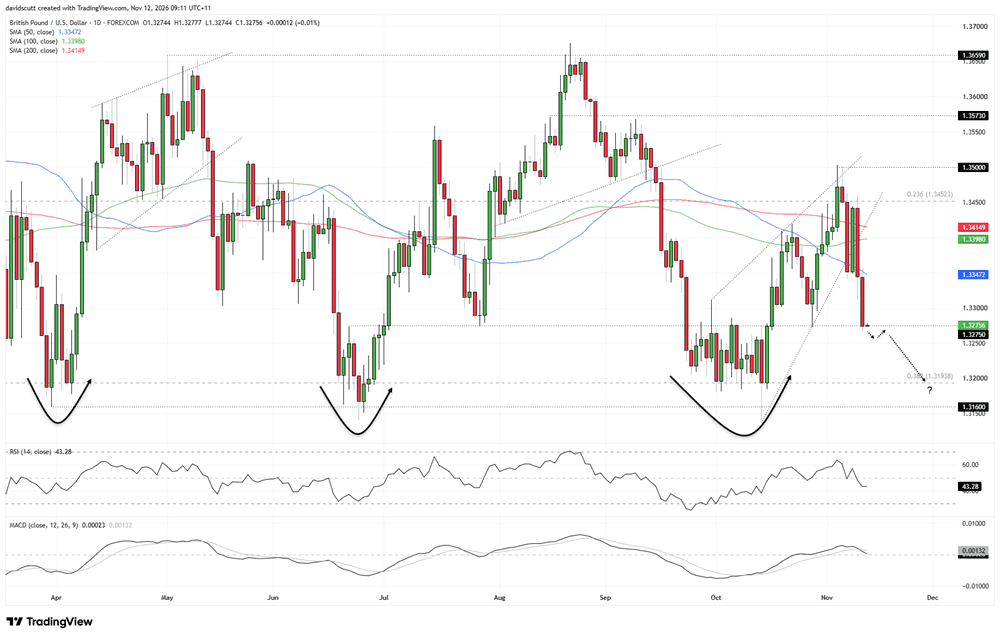
After failing on two occasions to break above 1.3500 earlier this month, GBP/USD has staged an abrupt reversal, breaking beneath the rising wedge it had been trading within throughout much of October and sliding below its 50, 100 and 200-day moving averages. The price has now come to rest at 1.3275, a level that has repeatedly acted as support and resistance over recent months, making it an appealing level to build trade setups around.
The broader technical picture favours further downside. Alongside the rising wedge breakdown and loss of the key moving averages, RSI (14) is making lower lows and has slipped back beneath 50, while MACD has staged a bearish crossover and is on the cusp of turning negative. With price action looking heavy and downside momentum building, a retest of the 38.2% Fibonacci retracement of the January 2025 to January 2026 advance at 1.3194 looks possible. That marks the upper boundary of a broader support zone extending down to 1.3160, where buyers have repeatedly stepped in during tests over this year.
For traders favouring shorts, a break beneath 1.3275 that sticks, preferably followed by a backtest and rejection, would provide an appealing entry point, allowing for a tight stop above the level for protection while targeting the support zone below.
Conversely, if 1.3275 continues to hold, there may be opportunities for countertrend longs, with stops placed beneath the level for protection. Initial upside targets include the 50, 100 and 200-day moving averages, followed by the 23.6% Fibonacci retracement of the January 2025 to January 2026 advance and potentially 1.3500. However, a sustained recovery towards the latter would likely require a significant rethink of the US interest rate outlook.
For now, the bias remains towards selling into strength or looking for downside breaks.
Latest market news




The complete CFD trading experience
Award-winning platforms, competitive spreads, low commissions and dedicated support.
We live and breathe the markets and are dedicated to helping traders realise their ambitions as we continue to set the industry bar.
Economic calendar
Web Trader platform
Our sophisticated web-based platform is packed with features.
Related articles
GBP/USD approaches breaking point as US yields surge
A historic repricing of US interest rate expectations has propelled the dollar higher, leaving GBP/USD testing a crucial support level ahead of UK GDP.
Japanese Yen Short-term Outlook: USD/JPY Breakout Hits 10-Week Highs—160 in Focus 11 11 2026
USD/JPY bulls need a decisive close above trend resistance to sustain the advance, with hotter U.S. inflation adding urgency to the test.

Pound forecast: GBP/USD and GBP/AUD in focus ahead of UK GDP
The GBP/USD fell below the 1.33 handle today as the dollar gained further ground against most major currencies. The GBP has remained supported against other currencies, thanks to a hawkish BoE and high UK interest rates.

StoneX Europe Ltd may make third party material available on this website which may contain information included but not limited to the conditions of financial markets. The material is for information purposes only and does not contain, and should not be construed as containing, investment advice and/or investment recommendation and/or an investment research and/or an offer of or solicitation for any transactions in financial instruments; any decision to enter into a specific transaction shall be made by the client following an assessment by him/her of their situation.
StoneX Europe Ltd makes no representation or warranty and assumes no liability as to the accuracy or completeness of the information provided, nor any loss arising from any investment based on a recommendation, forecast or other information supplied. You should always seek independent advice as to your suitability to speculate in any related markets and your ability to assume the associated risks, if you are at all unsure. We are not under any obligation to update any such material. Any opinion made may be personal to the author and may not reflect the opinion of StoneX Europe Ltd.