





GBP/USD, gold in focus for US PPI, retail sales: European Open
GBP/USD has formed a bearish reversal pattern beneath a failed breakout level, and gold looks set to retrace lower ahead of US PPI data.
Share this:

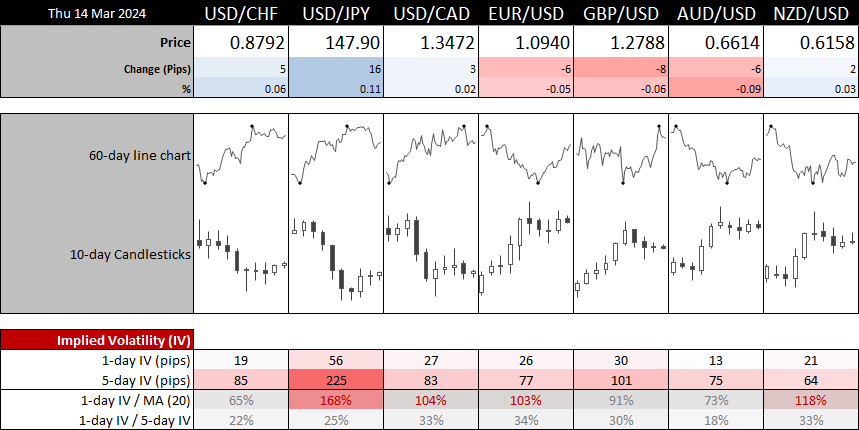
Markets have a close eye on US producer prices and retail sales data later today, as it could be used to confirm or deny this week’s hotter CPI report. And that seems to be suppressing volatility more than usual in today’s Asian session, not helped by the lack economic data this session.
To expect a binary outcome for the US dollar (and therefore key assets) we need to see both retail sales and PPI lean in the same direction. Hot data pushes further back on Fed cuts and likely support the US dollar, to the detriment of gold and its peer currencies (particularly commodity currencies such as AUD/USD, NZD/USD and USD/CAD). Whereas a soft set of figures from retail PPI could prompt another round of USD selling, crush yields and support gold on its way to a fresh record high.
I’m keeping an eye out to see if WTI crude oil to break above $80. It is trading close enough to assume at least an attempted breakout could occur, but the key to a sustainable breakout is volume. Yesterday’s bearish range expansion into the $80 resistance was on low volume, so bulls need to enter with conviction if they want any breakout to last.
Events in focus (GMT):
- 07:30 – Swiss PPI
- 08:00 – Spanish CPI
- 09:00 – International Energy Agency report
- 09:30 – ECB’s Elderson speaks
- 10:00 – China loan growth
- 12:30 – US producer prices, retail sales, jobless claims
GBP/USD technical analysis:
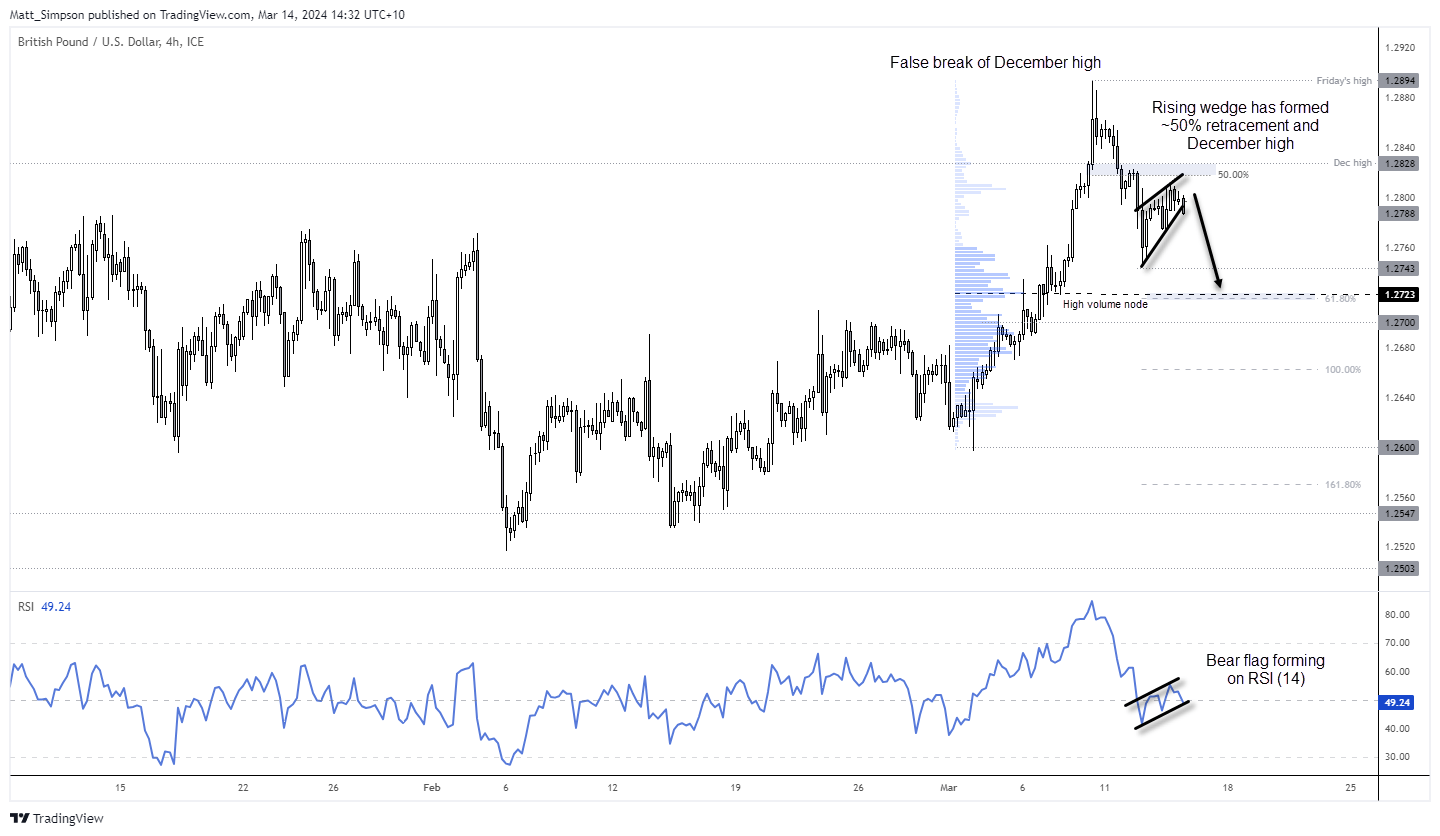
The British pound has caught my eye for an interesting short opportunity. GBP/USD saw a strong rally above the December high on Friday, only for prices to come crashing back beneath it on Monday. It is reminiscent of a miniature blowoff top.
But what has really caught my eye is the bearish continuation pattern forming beneath the December high (a rising wedge beneath the level which is now a false breakout). And that bearish wedge has met resistance at a 50% retracement level. The wedge projects a pattern near its base at 1.2743, but given the sharp reversal at the highs I suspect we might see a much deeper pullback.
The 61.8% projection from Friday’s high lands near the high-volume node around 1.2723, making it a potential target or support level should prices break beneath the 1.2743 low.
Gold technical analysis:
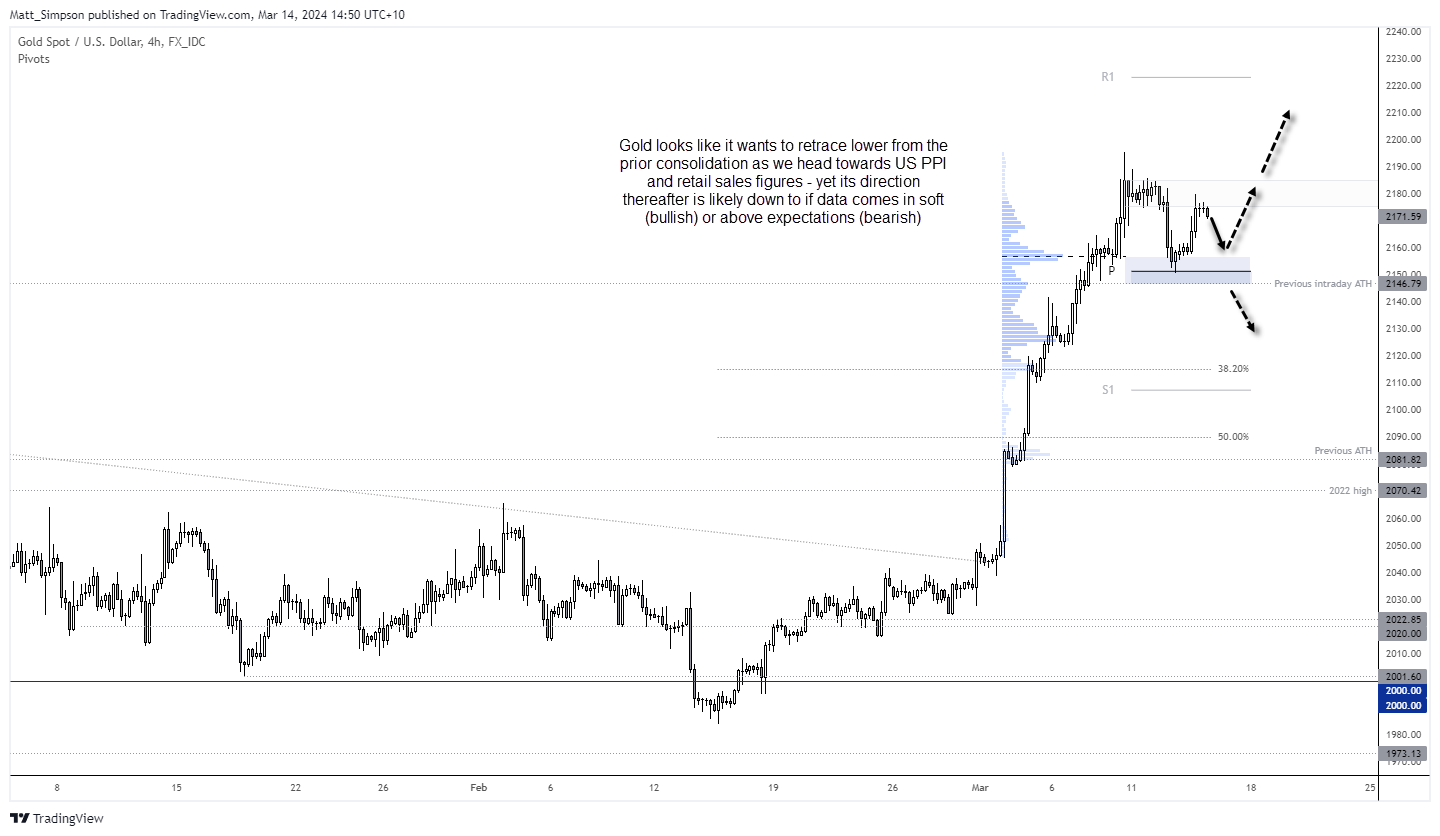
It was the hot US inflation report that finally snapped gold’s 9-day rally, and it could be today’s PPI report that decides which way gold goes from here. The post-CPI pullback fell nicely into the 2147-2156 support zone, an area which if broken assumes a much deeper correction for gold. But given the strong rally to its record high, I find it hard to envisage a single dip lower – as they usually come in three’s at a minimum.
It looks like momentum is trying to turn lower, so perhaps short gold into PPI data could be the way. But gold bears likely need a strong set of producer prices to push gold materially lower. Conversely, should PPI and retail sales figures roll over, then a break to a new record high could be on the cards.
View the full economic calendar
View the full economic calendar
-- Written by Matt Simpson
Follow Matt on Twitter @cLeverEdge
How to trade with City Index
You can trade with City Index by following these four easy steps:
- Open an account, or log in if you’re already a customer
• Open an account in the UK
• Open an account in Australia
• Open an account in Singapore
- Search for the market you want to trade in our award-winning platform
- Choose your position and size, and your stop and limit levels
- Place the trade
Related tags:


The complete CFD trading experience
Award-winning platforms, competitive spreads, low commissions and dedicated support.
We live and breathe the markets and are dedicated to helping traders realise their ambitions as we continue to set the industry bar.
Economic calendar
Web Trader platform
Our sophisticated web-based platform is packed with features.
Related articles

Gold forecast: Can XAU/USD hold $4000 support?
Gold has started the week trying to stabilise around the $4,000 level after last week’s 4% drop that saw the metal briefly drop and close below this psychological hurdle.


Can Gold Hold Its 2026 Lows as Silver Breaks Below Its Own?
Gold and silver prices are testing their 2026 lows as U.S. 10-year Treasury yields pull back more than 8% from highs last seen in 2002.


USD/JPY bulls back in business as AI trade roars back
The AI investment boom rolls on, with Anthropic and Meta helping revive enthusiasm across Wall Street. USD/JPY has responded with a bullish reversal pattern, putting its former trading range back in focus ahead of major central bank decisions and technology earnings.

StoneX Europe Ltd may make third party material available on this website which may contain information included but not limited to the conditions of financial markets. The material is for information purposes only and does not contain, and should not be construed as containing, investment advice and/or investment recommendation and/or an investment research and/or an offer of or solicitation for any transactions in financial instruments; any decision to enter into a specific transaction shall be made by the client following an assessment by him/her of their situation.
StoneX Europe Ltd makes no representation or warranty and assumes no liability as to the accuracy or completeness of the information provided, nor any loss arising from any investment based on a recommendation, forecast or other information supplied. You should always seek independent advice as to your suitability to speculate in any related markets and your ability to assume the associated risks, if you are at all unsure. We are not under any obligation to update any such material. Any opinion made may be personal to the author and may not reflect the opinion of StoneX Europe Ltd.