



GBPUSD, DXY Price Outlook: Will Hormuz Inflation Risks Tigger a Breakout This Week?
GBPUSD, DXY Price Outlook Will Hormuz inflation risks trigger a breakout this week following the sharp surge in US CPI and escalating tensions between the US and Iran after a stalemate in weekend negotiations?
Share this:

Will Hormuz inflation risks trigger a breakout this week following the sharp surge in US CPI and escalating tensions between the US and Iran after a stalemate in weekend negotiations?
Key Market Drivers
- US CPI y/y surged from 2.4% to 3.3% on Friday, marking the sharpest increase since 2025
- Hormuz tensions are escalating, with the US ordering a naval blockade on Iran, triggering renewed Iranian threats targeting Gulf ports
- Diverging narratives between the US and Iran regarding conflict resolution are likely to support short-term dollar strength and broader market weakness
- Eurozone CPI was the first to signal inflationary pressures, rising back above 2%, reinforcing expectations for tighter monetary policy as elevated energy prices persist
- UK CPI for March is due next week, currently near 3%, adding to inflation concerns amid what is one of the most significant energy shocks in recent history, supporting expectations for a more hawkish Bank of England alongside the ECB if tensions persist
From a Technical Angle
DXY Price Outlook: Weekly Time Frame – Log Scale
Source: Trading view
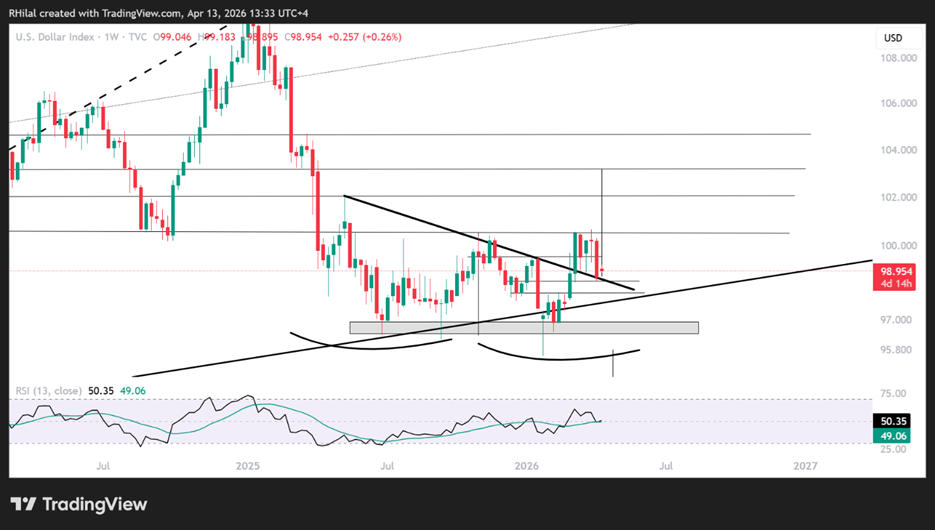
The DXY remains in a consolidation phase, caught between rising inflation expectations, driven by higher energy prices, and hopes that ceasefire negotiations could ease these pressures.
From a technical perspective, this is reflected in the 100.60 resistance and the 98.50–98 support zone.
Bullish Scenario
Price action suggests the formation of a double bottom pattern, with a descending neckline limiting upside attempts near the 100 level.
A confirmed close above 100.60 could open the path toward 101.80 and 104.60, extending downside pressure on major currencies and precious metals.
The bearish scenario is explained with the monthly time frame below
DXY Price Outlook: Monthly Time Frame – Log Scale

Source: Trading view
Alternative Scenario
A break below the 98 level would invalidate the double bottom structure, exposing the index to the 97–95 support range, aligned with the broader 2008–2026 uptrend. This zone remains critical in defining the longer-term directional bias for the dollar.
GBPUSD Price Outlook: Weekly Time Frame – Log Scale
Source: Trading view
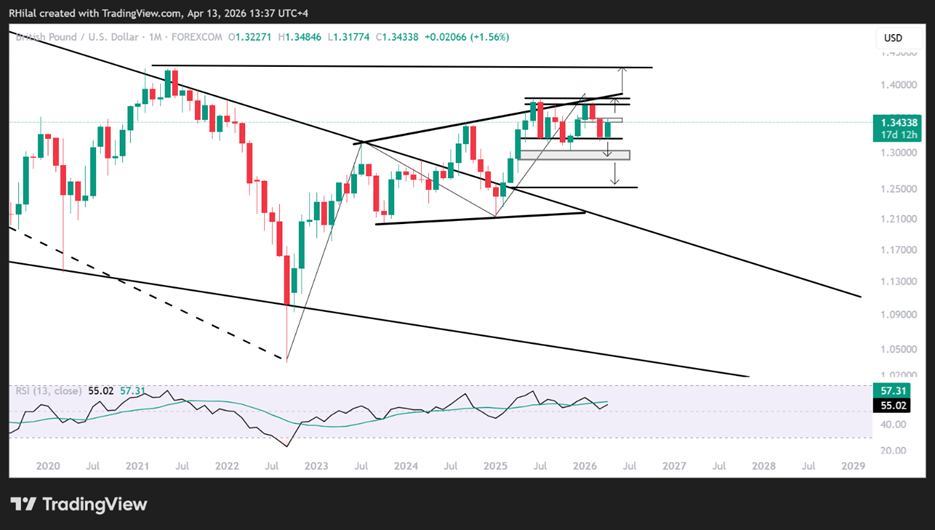
Similar to EURUSD, GBPUSD may be forming a double top pattern, opposing the DXY’s potential double bottom. The pair is struggling below the July 2023–January 2026 resistance zone near 1.38, while consolidating above the 1.32–1.30 support range.
Bullish Scenario
A move above the 1.3480 high could support a push toward the 1.37–1.3780 zone. A sustained break above 1.38 would strengthen the broader outlook toward 1.40–1.42.
Bearish Scenario
A break below 1.30 could expose downside toward 1.29 and 1.25, where potential recovery interest may emerge.
With sentiment heavily driven by headlines, focusing on confirmed closes beyond long-term key levels remains essential to minimize noise and avoid bull and bear traps.
Written by Razan Hilal, CMT
Follow on X: @Rh_waves


The complete CFD trading experience
Award-winning platforms, competitive spreads, low commissions and dedicated support.
We live and breathe the markets and are dedicated to helping traders realise their ambitions as we continue to set the industry bar.
Economic calendar
Web Trader platform
Our sophisticated web-based platform is packed with features.
Related articles
USD/CAD shooting star puts September surge on notice
USD/CAD has printed a clear bearish reversal pattern after an extraordinary September surge, but confirmation may depend heavily on how US Treasury yields react to Friday’s payrolls report.

USD/MXN Analysis: Is Super Peso Starting to Fade?
Over recent trading sessions, the Mexican peso has continued to show signs of weakness against the U.S. dollar. This can already be seen in USD/MXN, which has gained more than 1.7% over the last three sessions, highlighting sustained buying pressure in favor of the dollar in the short term.


Canadian Dollar Analysis: USD/CAD Returns to July Highs Ahead of NFP
The Canadian dollar continues to face one of its most challenging environments in recent months when it comes to maintaining strength against the U.S. dollar. The weakness of the Canadian currency is clearly reflected in USD/CAD, which has now recorded nine consecutive bullish sessions and gained more than 1.7% during that period.
StoneX Europe Ltd may make third party material available on this website which may contain information included but not limited to the conditions of financial markets. The material is for information purposes only and does not contain, and should not be construed as containing, investment advice and/or investment recommendation and/or an investment research and/or an offer of or solicitation for any transactions in financial instruments; any decision to enter into a specific transaction shall be made by the client following an assessment by him/her of their situation.
StoneX Europe Ltd makes no representation or warranty and assumes no liability as to the accuracy or completeness of the information provided, nor any loss arising from any investment based on a recommendation, forecast or other information supplied. You should always seek independent advice as to your suitability to speculate in any related markets and your ability to assume the associated risks, if you are at all unsure. We are not under any obligation to update any such material. Any opinion made may be personal to the author and may not reflect the opinion of StoneX Europe Ltd.