


Gold Bulls Regain Control Above $5100
Tariff drama has revived safe haven flows, lifting bullion through resistance and resetting the tactical landscape for traders.
Share this:

- Breakout above $5100 shifts near term bias back to bullish
- Momentum strong but short-term stretch signals flashing
- $5100 now key pivot for continuation vs failure
Dollar Pressure Returns
Just as we saw immediately after the Liberation Day tariff rate announcement in early April last year, markets are again showing pressure on the US dollar alongside renewed demand for safe havens.
As a safe haven predominantly priced in USD, gold has rallied following the SCOTUS ruling that Trump’s reciprocal tariffs were illegal. Trump’s response, announcing 15% global levies to be introduced Tuesday under Section 122, grants him 150 days to formulate a sustainable plan.
That window matters. A potentially sizeable government revenue gap risks amplifying concerns surrounding the US fiscal outlook and, by extension, the future value of the dollar.
Breakout Resets Technical Picture
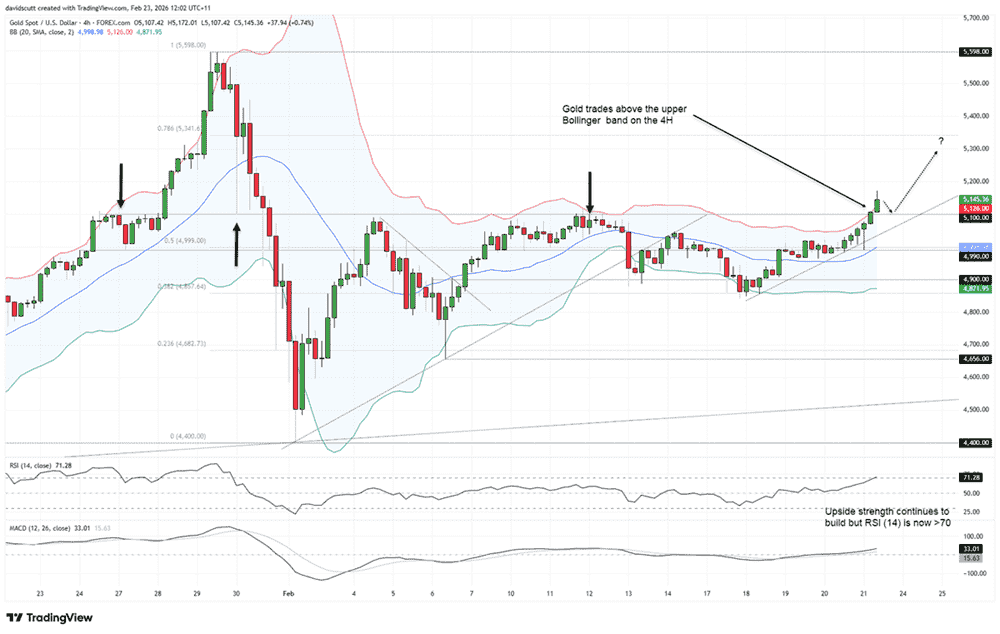
Source: TradingView
On the charts, gold’s breakout above $5100 looks significant. The move suggests it may be embarking on a fresh leg higher following a prolonged consolidation phase after the bloodbath in late January and early February, when speculative long positioning was forced to unwind as prices cascaded lower.
The breakout also provides traders with a clean level to work with when constructing bullish setups, offering a logical reference point for protection on fresh longs.
However, entry looms as critical despite the bullish signal. Gold is now trading above its upper Bollinger Band on the 4H timeframe, hinting that the move may be getting somewhat stretched. RSI (14) has also crept back into overbought territory, reinforcing the more cautious near-term message.
Yes, RSI (14) continues to trend higher, indicating upside momentum is building, a message confirmed by MACD which has crossed the signal line before flipping into positive territory. Even so, the preference would be to see a pullback towards, or to, $5100 before considering entry.
It may not happen, but that remains the more appealing scenario. A retest would help improve risk reward dynamics while revealing whether bulls are willing to defend the breakout level.
There are relatively few clear levels overhead given the speed of the earlier unwind. Key areas to monitor include the 78.6% Fibonacci retracement of the January to February high low move at $5341, along with $5450 where an attempted bounce following the initial gold sell off was met with ferocious selling on January 30.
A sustained break above that zone would likely embolden bulls, opening the door to a retest of the record high at $5598 and potential resumption of the broader bullish trend.
Conversely, a reversal back beneath $5100 that holds would invalidate the bullish bias, pointing to the risk of renewed downside and a possible retest of the February lows.
Latest market news




The complete CFD trading experience
Award-winning platforms, competitive spreads, low commissions and dedicated support.
We live and breathe the markets and are dedicated to helping traders realise their ambitions as we continue to set the industry bar.
Economic calendar
Web Trader platform
Our sophisticated web-based platform is packed with features.
Related articles
USD/JPY Q4 2026 Outlook: Hawkish Fed Pricing Clashes With Intervention Risk
The year-end tug-of-war is clear: hawkish Fed pricing supports USD/JPY, while intervention risk limits the upside.
Japanese Yen Forecast: USD/JPY 4% Rally Challenges Post-Intervention Downtrend 9 24 2026
USD/JPY momentum has shifted sharply higher, putting a major resistance confluence in focus as U.S. and Japanese event risk builds.


Oil Quietly Hands the Fed a Reason to Stay Hawkish
Oil prices and the U.S. dollar are both on the front foot as elevated energy costs feed Fed warnings that inflation may prove sticky.

StoneX Europe Ltd may make third party material available on this website which may contain information included but not limited to the conditions of financial markets. The material is for information purposes only and does not contain, and should not be construed as containing, investment advice and/or investment recommendation and/or an investment research and/or an offer of or solicitation for any transactions in financial instruments; any decision to enter into a specific transaction shall be made by the client following an assessment by him/her of their situation.
StoneX Europe Ltd makes no representation or warranty and assumes no liability as to the accuracy or completeness of the information provided, nor any loss arising from any investment based on a recommendation, forecast or other information supplied. You should always seek independent advice as to your suitability to speculate in any related markets and your ability to assume the associated risks, if you are at all unsure. We are not under any obligation to update any such material. Any opinion made may be personal to the author and may not reflect the opinion of StoneX Europe Ltd.