


S&P 500 Analysis: Earnings Uncertainty Continues to Weigh on the SPX
The trading week is coming to an end, and a phase of weakness remains evident across the S&P 500 in the short term. Recent price action reflects this dynamic, with SPX losing more than 2.00% over the last two trading sessions, bringing selling pressure back into focus.
Share this:

The trading week is coming to an end, and a phase of weakness remains evident across the S&P 500 in the short term. Recent price action reflects this dynamic, with SPX losing more than 2.00% over the last two trading sessions, bringing selling pressure back into focus.
Part of this weakness stems from recent earnings releases from some of the index's largest constituents, which have failed to generate a sustained sense of confidence among investors. At the same time, expectations that interest rates could remain elevated into year-end continue to weigh on sentiment. Together, these factors have limited risk appetite and could keep a cautious tone in place over the coming sessions.

Are Earnings Disappointing the Market?
This week was marked by earnings releases from several key companies within the S&P 500. Although some reports managed to beat expectations in certain areas, the broader market reaction has been driven more by concerns surrounding capital expenditures and the ability of these investments to translate into sustainable growth over the coming years.
At the beginning of the week, Microsoft reported revenue above $92 billion, exceeding expectations, while adjusted earnings per share came in near $4.90, above the expected $4.70. However, the market remains concerned about the pace of capital spending growth, and the stock has fallen close to 2.00% since the earnings release.
Later, Alphabet (Google) delivered a more visible slowdown. Earnings per share came in near $2.70, below the expected $3.00, while revenue reached approximately $127 billion, slightly below the $128 billion forecast by the market. In addition, continued growth in capital expenditures has raised concerns about the company's growth prospects for 2027. As a result, Alphabet shares have declined roughly 13.00% since reporting earnings.
Another relevant event was Amazon's earnings release, which also failed to meet expectations. The company reported earnings per share of $1.89 compared with forecasts of $1.96, while investors once again focused on the elevated pace of investment during the latest quarter, a dynamic that continues to pressure free cash flow. Since reporting earnings, Amazon shares have declined close to 2.00%.
The common theme across these reports is growing concern around capital expenditures within the technology sector. Investors are increasingly questioning when these large investments, particularly those linked to artificial intelligence and technological expansion, will begin translating into stronger revenue growth and profitability.
This concern is no longer limited to the companies that reported results. Looking at the recent performance of the Top 10 companies in the S&P 500, only Eli Lilly managed to post a gain of more than 3.1%, while the rest of the group recorded negative performance. This suggests that uncertainty is beginning to affect a broader portion of the technology sector and the index as a whole.
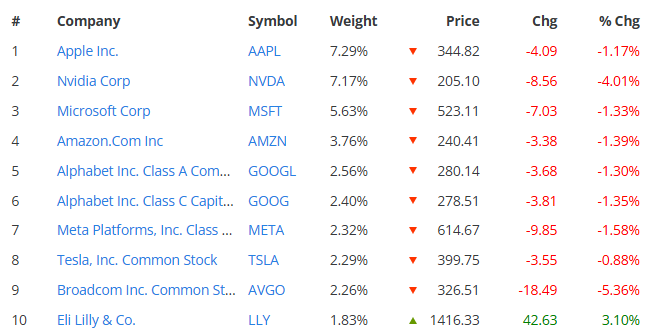
Source: Slickcharts
With all of this in mind, uncertainty has begun to play a more important role within the S&P 500. Concerns surrounding future corporate growth, particularly in light of rising investment spending, have reduced part of the confidence that supported markets in previous months and have limited the ability of major index components to attract consistent demand. As long as these concerns remain present throughout earnings season, selling pressure could continue to be relevant in the sessions ahead.
Is the Federal Reserve Still a Problem?
This week also featured the latest Federal Reserve policy decision. While the central bank left interest rates unchanged, officials reiterated that inflation remains an important concern and that there is still room to maintain a relatively restrictive monetary policy stance.
According to current market probabilities, there remains more than a 70% chance that the Fed could deliver an additional rate increase during the December 9 meeting, taking the benchmark rate toward 4.25%. This suggests that, despite the Fed's relatively cautious tone, the possibility of higher rates before the end of 2026 has not disappeared.
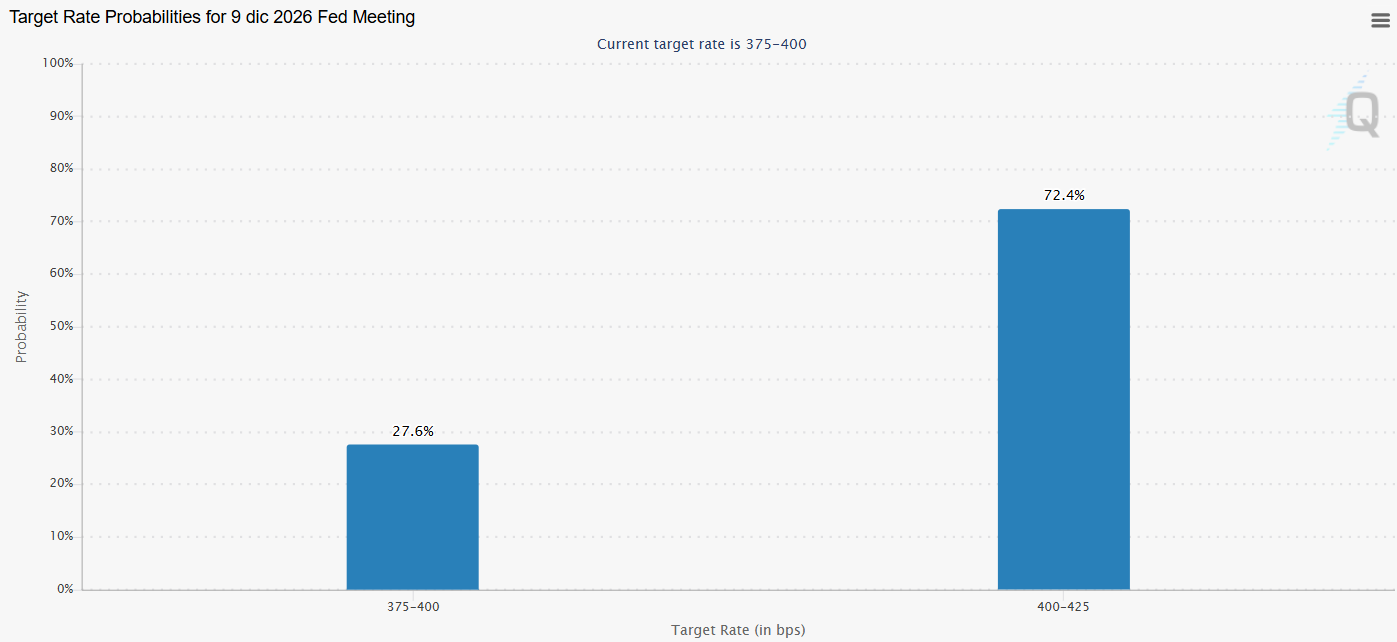
Source: CMEGROUP
This remains important because expectations of higher interest rates continue to represent a challenge for equity markets. A higher-rate environment can reduce liquidity, increase financing costs, and limit both consumer spending and corporate investment activity. It can also weigh on future growth expectations for companies within the index.
For this reason, as long as the market continues to price in the possibility of additional rate increases toward year-end, a cautious tone around risk assets could remain in place. Under this scenario, a Federal Reserve that keeps the door open to a more restrictive policy stance could continue limiting confidence and support a relatively weak environment for the S&P 500 over the longer term.
S&P 500 Technical Forecast
Source: StoneX, Tradingview
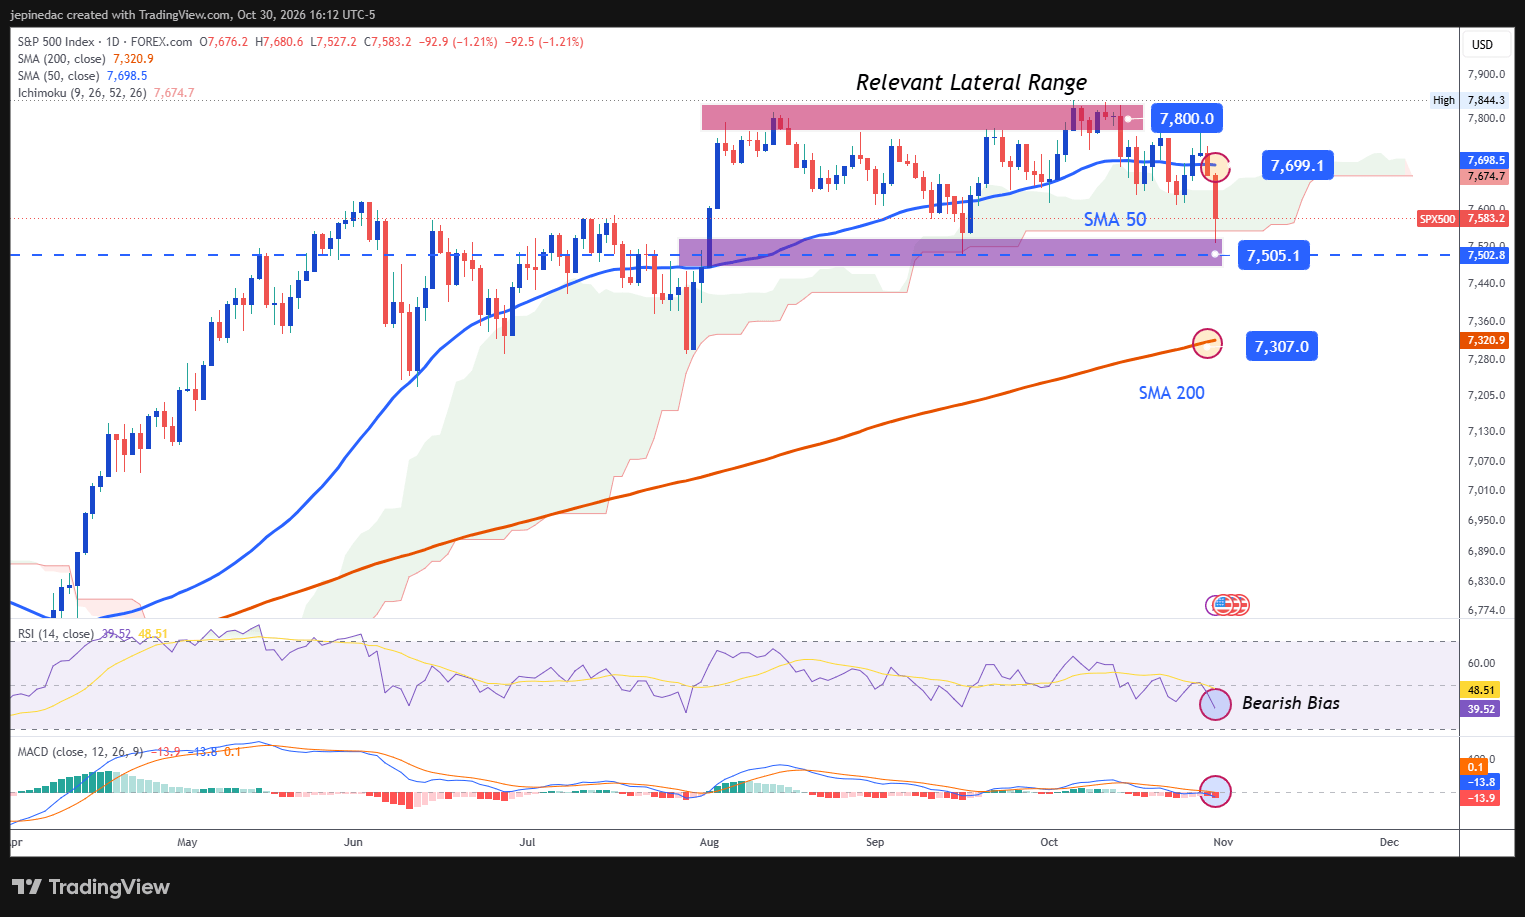
- Weakness begins to gain traction: Although the S&P 500 had been developing within a relatively stable trading range over recent weeks, the latest selling pressure has pushed the index closer to the lower boundary of that structure. If price action begins to break through key support levels, this could create room for a more established bearish phase in the weeks ahead.
- MACD: The MACD histogram continues to trade below the 0 neutral line, suggesting that selling pressure has begun to dominate short-term moving averages. As long as this behavior remains in place, the bearish bias could continue gaining relevance.
- RSI: The RSI also reflects weakness, as the indicator remains below the 50 neutral level. This suggests that selling momentum has once again become dominant and supports the possibility that downside pressure could remain relevant in the near term.
Key Levels:
- 7,800 points – Key Resistance: An all-time high area that represents the most important upside barrier on the chart. A return toward this level could reduce the relevance of the recent bearish move and restore confidence in the longer-term bullish structure observed in previous months.
- 7,700 points – Near-Term Barrier: A key equilibrium zone that aligns with the 50-period moving average. Price action returning toward this level could once again highlight a lack of direction and reinforce the trading range that currently dominates the chart.
- 7,500 points – Key Support: An important inflection zone that also develops below the Ichimoku Cloud, making it the most relevant downside barrier on the chart. Sustained price action below this level could confirm a more meaningful structural shift and open the door to a more consistent bearish trend in the weeks ahead.
Written by Julian Pineda, CFA, CMT – Market Analyst
Follow him on: @julianpineda25



The complete CFD trading experience
Award-winning platforms, competitive spreads, low commissions and dedicated support.
We live and breathe the markets and are dedicated to helping traders realise their ambitions as we continue to set the industry bar.
Economic calendar
Web Trader platform
Our sophisticated web-based platform is packed with features.
Related articles
S&P 500 Analysis: Earnings Uncertainty Continues to Weigh on the SPX
The trading week is coming to an end, and a phase of weakness remains evident across the S&P 500 in the short term. Recent price action reflects this dynamic, with SPX losing more than 2.00% over the last two trading sessions, bringing selling pressure back into focus.

Nasdaq 100, S&P 500 Smashed as AI Bubble Fears Run Risk Aversion
It’s been a rocky few weeks for stocks starting with a bearish engulf in NVDA a few weeks ago and then the same formation in the S&P 500 two weeks ago. Sellers have since chewed through supports and fear is starting to spread, but is this the beginning of the end for the AI rally?


Nasdaq 100 forecast: Alphabet results reignite AI concerns
Disappointing results from a couple of major global technology names have put the AI trade back under scrutiny, with Nasdaq 100 futures falling around 1% after giving up the post-FOMC gains seen overnight. For now, our short-term Nasdaq 100 forecast remains more on the cautious side of things than outright bearish. The index remains close to its record highs and continues to find dip buyers. But could that change soon?

StoneX Europe Ltd may make third party material available on this website which may contain information included but not limited to the conditions of financial markets. The material is for information purposes only and does not contain, and should not be construed as containing, investment advice and/or investment recommendation and/or an investment research and/or an offer of or solicitation for any transactions in financial instruments; any decision to enter into a specific transaction shall be made by the client following an assessment by him/her of their situation.
StoneX Europe Ltd makes no representation or warranty and assumes no liability as to the accuracy or completeness of the information provided, nor any loss arising from any investment based on a recommendation, forecast or other information supplied. You should always seek independent advice as to your suitability to speculate in any related markets and your ability to assume the associated risks, if you are at all unsure. We are not under any obligation to update any such material. Any opinion made may be personal to the author and may not reflect the opinion of StoneX Europe Ltd.