



Gold continues selloff as China manufacturing data worsens
Until confidence returns that prices from China will move higher, Gold may begin trading in a range.
Share this:

Fears of deflation caused by lockdowns in China have helped Gold continue its slide lower. Over the course of the last few weeks, the lockdowns in Shanghai and potentially Beijing have led to poor manufacturing data while inflation remains low. The NBS Manufacturing PMI for April was 47.4 vs 48 expected at 49.5 last. The Non-Manufacturing print was even worse at 41.9 vs 48 expected at 48.4 in March. Both prints are well below the 50 level, which is considered contractionary territory. China March inflation rate for March was only 1.5% YoY.
Gold (XAU/USD) has been moving aggressively lower since forming a shooting start on April 18th as fears spread that the lockdowns in Shanghai could be extended to Beijing. Gold put in a high of 1998.35 just 2 weeks ago and, thus far, has traded down to today’s low at 1854.68. Price today also broke through the 50% retracement level from the lows of August 9th, 2021 to the highs of March 8th. A confluence of support sits just below. This level consists of the following:
- The 200 Day Moving Average
- The downward sloping trendline from a longer-term symmetrical triangle
- The 61.8% Fibonacci retracement level from the above-mentioned timeframe
This support zone crosses between 1828.62 and 1834.91.

Source: Tradingview, Stone X
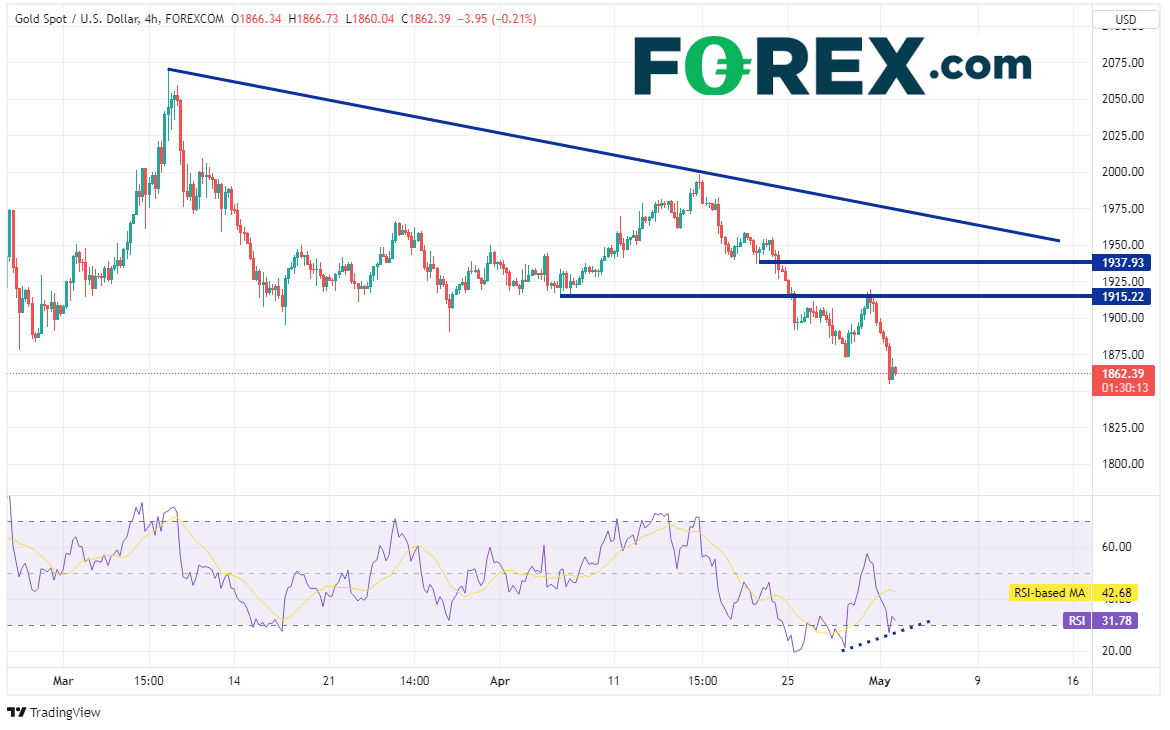
However, notice that the RSI on the 240-minute timeframe is diverging with price, an indication that Gold may be ready for a bounce. First resistance is at today’s high near 1914.68. Above there is horizontal resistance from April 21st at 1937.93 then a downward sloping trendline dating to March 8th near 1974.50.
Source: Tradingview, Stone X
Gold has been moving lower since March 8th; however, the selloff has picked up strength recently on fears of deflation due to lockdowns in China. The PMI data doesn’t give much hope that prices will rise anytime soon. Is Gold ready to bounce? The shorter-term timeframe RSI looks to be oversold; therefore a near-term bounce is possible. However, until confidence returns that prices from China will move higher, Gold may begin trading in a range.
Fears of deflation caused by lockdowns in China have helped Gold continue its slide lower. Over the course of the last few weeks, the lockdowns in Shanghai and potentially Beijing have led to poor manufacturing data while inflation remains low. The NBS Manufacturing PMI for April was 47.4 vs 48 expected at 49.5 last. The Non-Manufacturing print was even worse at 41.9 vs 48 expected at 48.4 in March. Both prints are well below the 50 level, which is considered contractionary territory. China March inflation rate for March was only 1.5% YoY.
Gold (XAU/USD) has been moving aggressively lower since forming a shooting start on April 18th as fears spread that the lockdowns in Shanghai could be extended to Beijing. Gold put in a high of 1998.35 just 2 weeks ago and, thus far, has traded down to today’s low at 1854.68. Price today also broke through the 50% retracement level from the lows of August 9th, 2021 to the highs of March 8th. A confluence of support sits just below. This level consists of the following:
- The 200 Day Moving Average
- The downward sloping trendline from a longer-term symmetrical triangle
- The 61.8% Fibonacci retracement level from the above-mentioned timeframe
This support zone crosses between 1828.62 and 1834.91.

Source: Tradingview, Stone X
Trade Gold now: Login or Open a new account!
• Open an account in the UK
• Open an account in Australia
• Open an account in Singapore
However, notice that the RSI on the 240-minute timeframe is diverging with price, an indication that Gold may be ready for a bounce. First resistance is at today’s high near 1914.68. Above there is horizontal resistance from April 21st at 1937.93 then a downward sloping trendline dating to March 8th near 1974.50.

Source: Tradingview, Stone X
Gold has been moving lower since March 8th; however, the selloff has picked up strength recently on fears of deflation due to lockdowns in China. The PMI data doesn’t give much hope that prices will rise anytime soon. Is Gold ready to bounce? The shorter-term timeframe RSI looks to be oversold; therefore a near-term bounce is possible. However, until confidence returns that prices from China will move higher, Gold may begin trading in a range.
Learn more about metals trading opportunities.
Related tags:
Latest market news




The complete CFD trading experience
Award-winning platforms, competitive spreads, low commissions and dedicated support.
We live and breathe the markets and are dedicated to helping traders realise their ambitions as we continue to set the industry bar.
Economic calendar
Web Trader platform
Our sophisticated web-based platform is packed with features.
Related articles
Canadian Dollar Analysis: USD/CAD Returns to July Highs Ahead of NFP
The Canadian dollar continues to face one of its most challenging environments in recent months when it comes to maintaining strength against the U.S. dollar. The weakness of the Canadian currency is clearly reflected in USD/CAD, which has now recorded nine consecutive bullish sessions and gained more than 1.7% during that period.
US Dollar Technical Outlook: DXY Bulls Meet Resistance at Yearly Highs 10 1 2026
The U.S. Dollar has held firm despite fading Fed hike bets, but Friday’s payrolls could test the rally’s staying power.


Dow Jones forecast: Stock markets under pressure from multiple sources
When looking at the major tech-heavy US indices like the S&P 500 or the Nasdaq 100, you wouldn’t think that the stock market is particularly weak. Yet, beneath the surface, the market is far from healthy right now. Investors are evidently just piling into the big tech and AI names, and as a result, market breadth is deteriorating. Other indices like the small cap Russell 2000 and the Dow Jones are starting to reflect that weakness.

StoneX Europe Ltd may make third party material available on this website which may contain information included but not limited to the conditions of financial markets. The material is for information purposes only and does not contain, and should not be construed as containing, investment advice and/or investment recommendation and/or an investment research and/or an offer of or solicitation for any transactions in financial instruments; any decision to enter into a specific transaction shall be made by the client following an assessment by him/her of their situation.
StoneX Europe Ltd makes no representation or warranty and assumes no liability as to the accuracy or completeness of the information provided, nor any loss arising from any investment based on a recommendation, forecast or other information supplied. You should always seek independent advice as to your suitability to speculate in any related markets and your ability to assume the associated risks, if you are at all unsure. We are not under any obligation to update any such material. Any opinion made may be personal to the author and may not reflect the opinion of StoneX Europe Ltd.