



Gold Forecast: XAU/USD Stalls Around $4,600 Ahead of Jackson Hole
Gold's price action has changed notably during the week. Over the last four trading sessions, the precious metal has advanced only slightly more than 1%, highlighting a clear slowdown around the $4,600 per ounce area.
Share this:

Gold's price action has changed notably during the week. Over the last four trading sessions, the precious metal has advanced only slightly more than 1%, highlighting a clear slowdown around the $4,600 per ounce area. This period of weaker directional momentum is being driven primarily by market expectations ahead of Kevin Warsh's speech at Jackson Hole tomorrow, as well as the stability that continues to be observed in alternative markets such as the U.S. dollar and Treasury bonds. As long as these factors continue to limit fresh demand, gold could remain trapped in a more balanced trading environment over the coming sessions.

Factors That Could Limit Gold's Advance
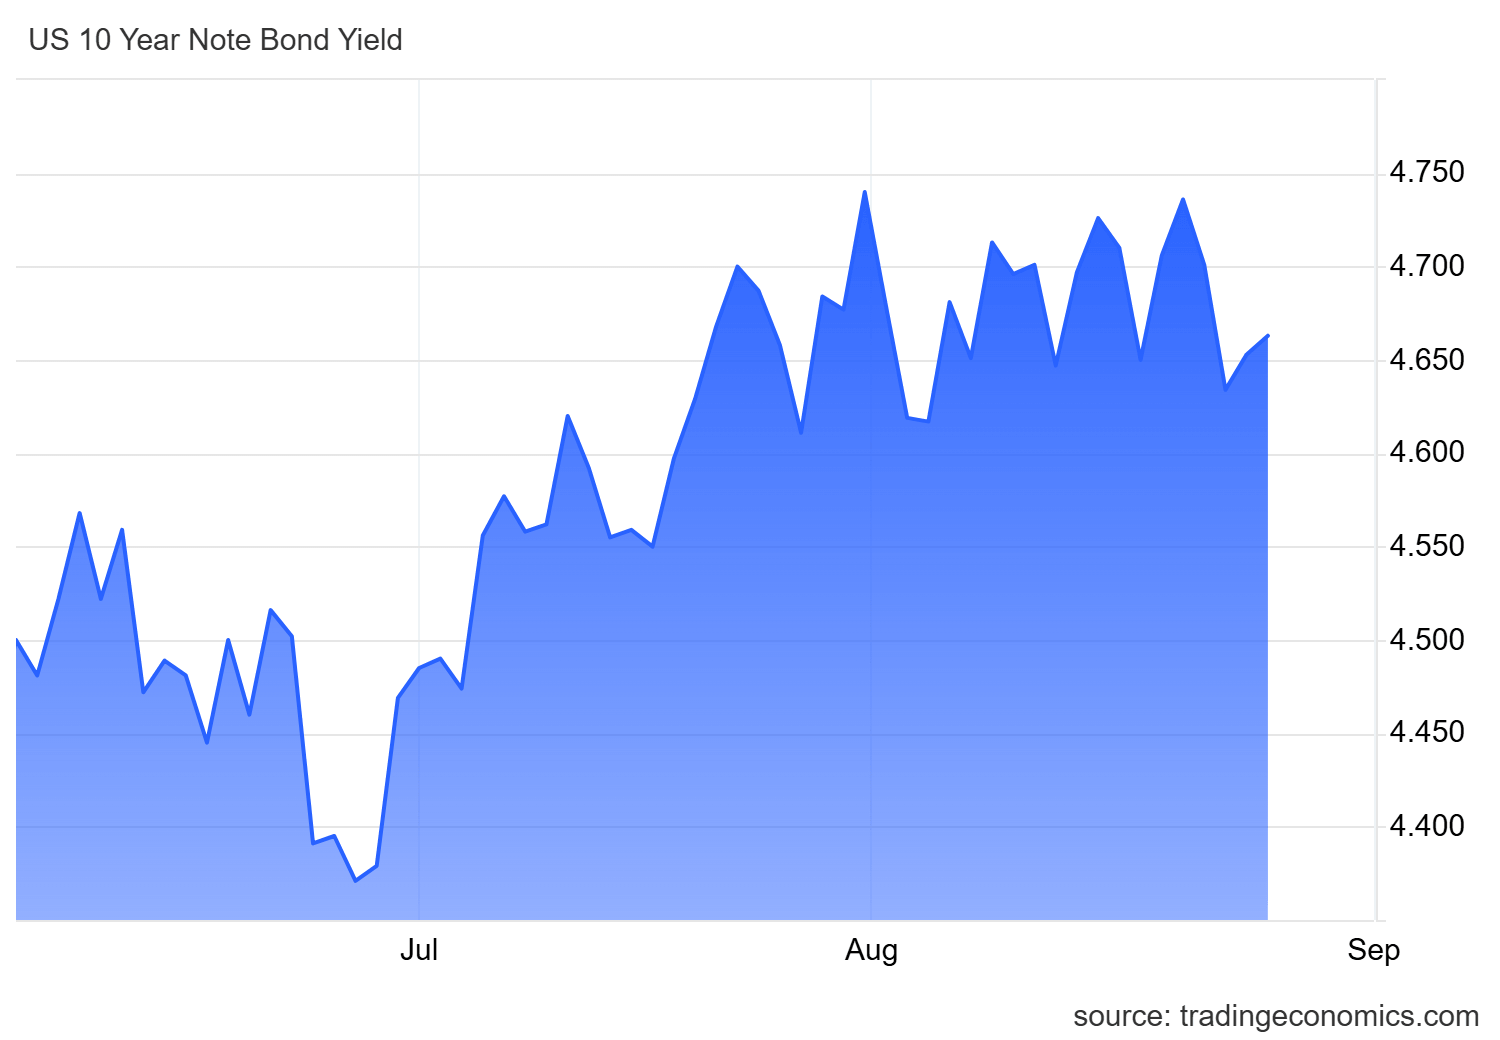
One of the first elements worth monitoring is the behavior of the U.S. bond market, one of gold's main competitors among traditionally defensive assets. 10-year Treasury yields continue to show resilience and remain above the 4.6% area, with no clear signs of a sustained decline that could reduce the attractiveness of fixed-income markets.
This remains relevant for gold because, unlike bonds, the precious metal does not generate interest income. As a result, while yields remain elevated and relatively stable, part of investor demand may continue to favor fixed-income assets, limiting gold's ability to develop a stronger recovery.
Source: TradingEconomics
A similar situation can be seen in the behavior of the U.S. dollar. The currency has remained relatively stable as markets await Kevin Warsh's remarks at Jackson Hole, an event that could provide important clues regarding how Federal Reserve officials view inflation dynamics and the future path of monetary policy.
Investors are primarily focused on whether current economic conditions continue to justify elevated interest rates or whether conditions could begin to support policy adjustments in the months ahead. In this context, a more hawkish tone than expected could once again push bond yields higher and strengthen the relative appeal of dollar-denominated investments, a combination that typically does not support gold prices.
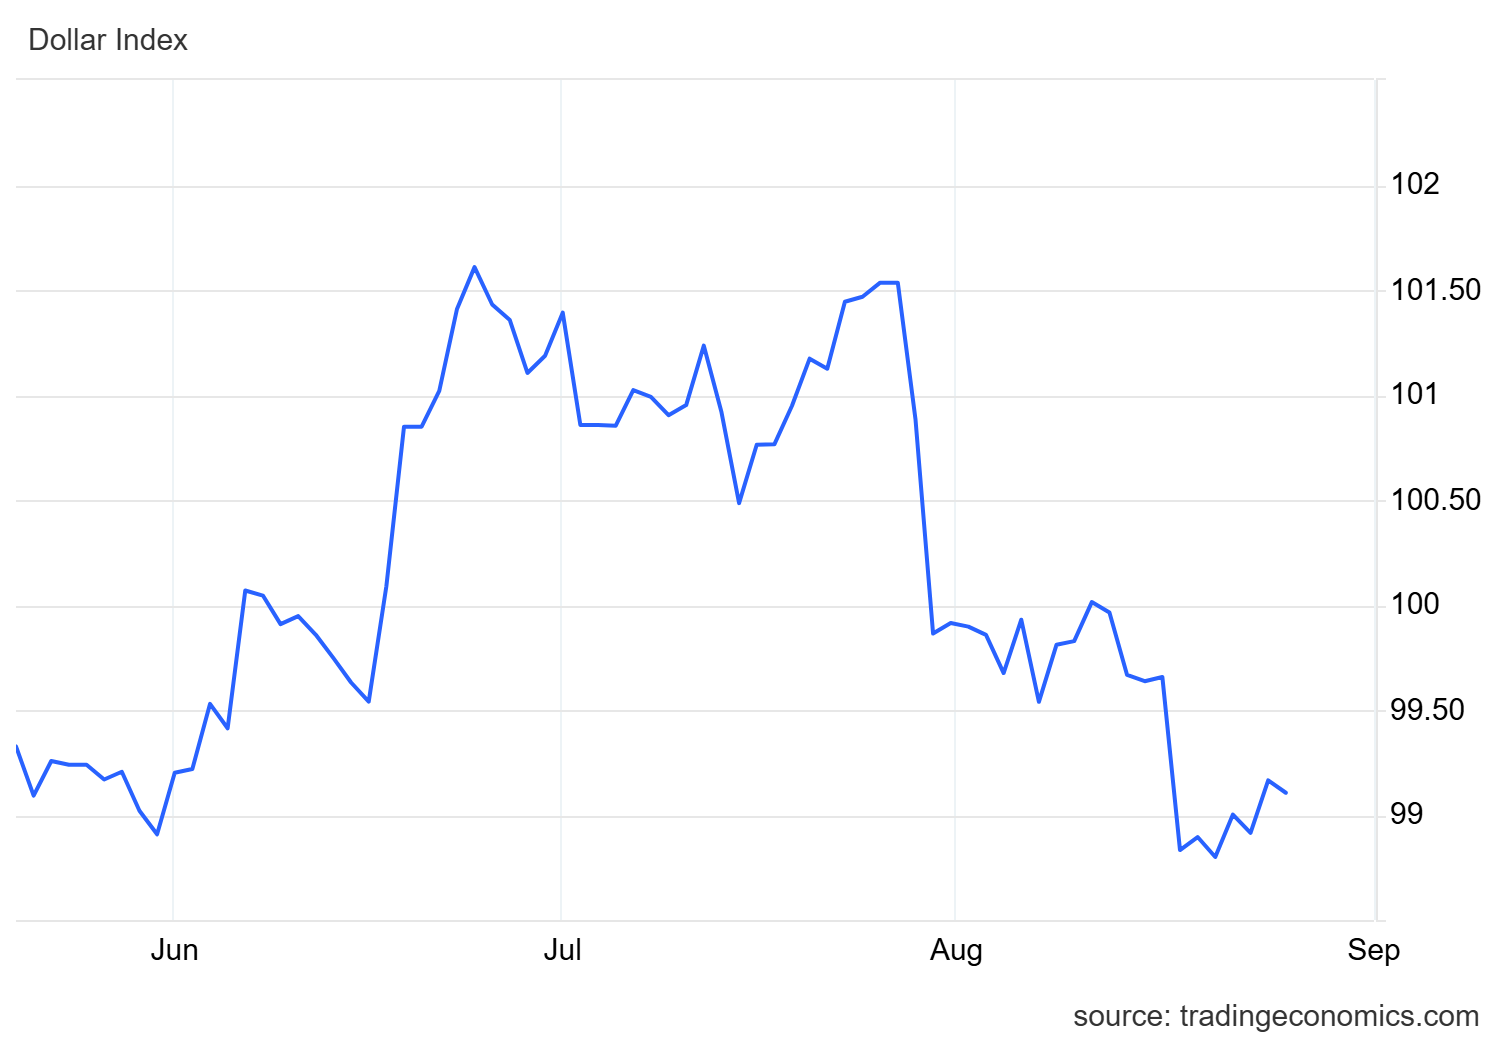
This cautious stance is already being reflected in the DXY Index, which measures the U.S. dollar's performance against its major peers. The index remains stable around the 99-point area and, for now, is not showing additional signs of weakness. Rather than signaling a strong recovery in the dollar, markets appear to be adopting a wait-and-see approach ahead of new information from Jackson Hole.
Source: TradingEconomics
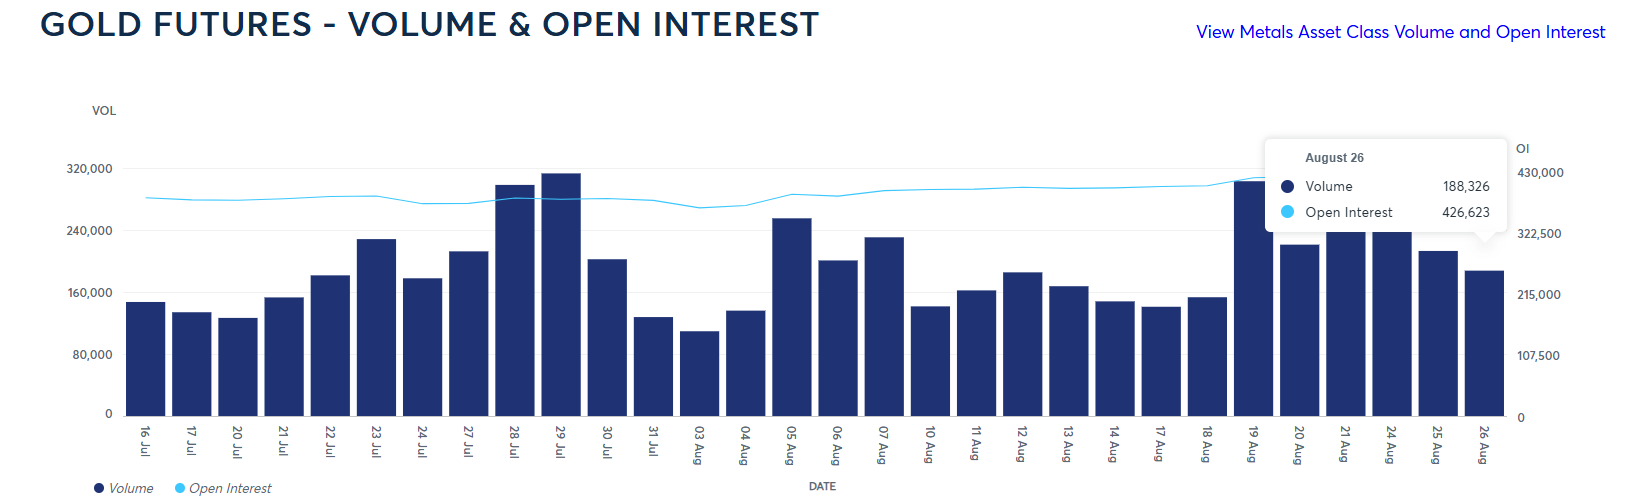
This environment has also started to affect activity within the gold market. Gold futures volumes have declined noticeably over recent sessions. On August 26, trading activity stood near 188,000 contracts, significantly below the nearly 300,000 contracts recorded on August 19.
The decline in participation suggests that a portion of market participants has adopted a more cautious stance while awaiting greater clarity on U.S. monetary policy and the behavior of alternative markets such as bonds and the U.S. dollar. This reduced activity may be limiting gold's ability to establish a more decisive trend.
Source: CMEGROUP
Against this backdrop, gold appears to be entering a particularly sensitive phase. As long as expectations surrounding Jackson Hole and the stability observed in alternative markets continue to influence demand, it may be difficult for the metal to regain the momentum seen in previous weeks. As a result, current market conditions may continue to favor a more pronounced period of indecision in XAU/USD price action over the coming sessions.
Gold Technical Outlook
Source: StoneX, Tradingview
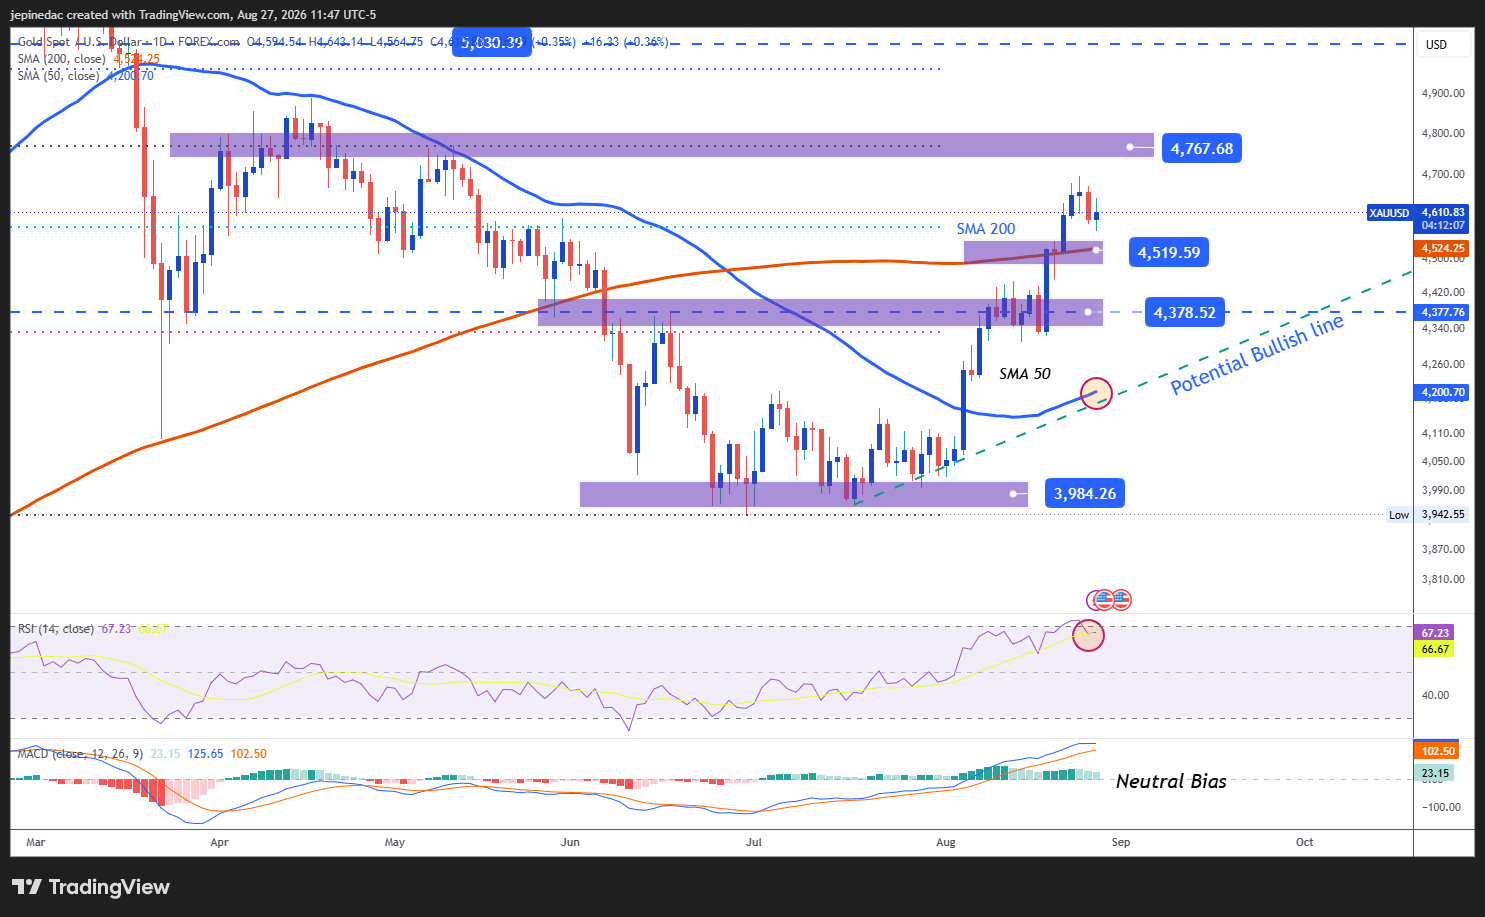
- Bullish Momentum Faces a Slowdown: Although the long-term chart continues to support the development of a potential bullish trendline, recent price action reflects a clear slowdown in buying pressure around the 200-period Simple Moving Average. Unless stronger directional momentum emerges, the market may continue moving through a neutral phase that could even create room for a short-term consolidation range.
- RSI: The RSI has retreated from overbought levels above the 70 threshold. While this suggests that bullish momentum remains present, it also reflects a moderation in the strength observed during previous weeks. If this pattern continues, it may further reinforce a more balanced market environment.
- MACD: The MACD histogram remains very close to the neutral 0 line, indicating that the average strength of short-term moving averages remains relatively balanced. This technical reading supports the possibility that a lack of direction could continue to dominate trading conditions in the near term.
Key Levels to Watch:
- $4,700 – Critical Resistance: An important upside barrier that coincides with highs recorded in previous weeks. Price action capable of breaking above this level could revive bullish dominance and reinforce the importance of the underlying trendline as the primary market structure.
- $4,500 – Nearby Barrier: An equilibrium zone that coincides with the 200-period Simple Moving Average. As long as prices continue trading near this area, the market may continue to display limited directional conviction, potentially supporting the development of a short-term consolidation range.
- $4,370 – Critical Support: A level associated with recent lows and the most important downside reference currently visible on the chart. A return toward this region could challenge the validity of the bullish trendline and create room for a more meaningful bearish bias to emerge over the coming weeks.
Written by Julian Pineda, CFA, CMT – Market Analyst
Follow him on: @julianpineda25
Latest market news




The complete CFD trading experience
Award-winning platforms, competitive spreads, low commissions and dedicated support.
We live and breathe the markets and are dedicated to helping traders realise their ambitions as we continue to set the industry bar.
Economic calendar
Web Trader platform
Our sophisticated web-based platform is packed with features.
Related articles
S&P 500 Forecast: SPX holds steady as tech stocks decline and banks rise post-earnings
U.S. stocks are mixed ahead of the open on Tuesday, with tech stocks leading the decline as investors also weigh bank earnings.


GBP/USD, XAU/USD Forecast: Two trades to watch
GBP/USD rises amid a weaker USD, but gains could be limited. Gold rises as Oil, Treasury yields slip, central bank buying remains strong.

DXY at Key Resistance as FX Majors Lie in Wait| Weekly Technical Outlook 10 12 2026
Sr. Technical Strategist Michael Boutros highlights the levels that matter on the USD Majors, commodities, and equity indices charts this week.

StoneX Europe Ltd may make third party material available on this website which may contain information included but not limited to the conditions of financial markets. The material is for information purposes only and does not contain, and should not be construed as containing, investment advice and/or investment recommendation and/or an investment research and/or an offer of or solicitation for any transactions in financial instruments; any decision to enter into a specific transaction shall be made by the client following an assessment by him/her of their situation.
StoneX Europe Ltd makes no representation or warranty and assumes no liability as to the accuracy or completeness of the information provided, nor any loss arising from any investment based on a recommendation, forecast or other information supplied. You should always seek independent advice as to your suitability to speculate in any related markets and your ability to assume the associated risks, if you are at all unsure. We are not under any obligation to update any such material. Any opinion made may be personal to the author and may not reflect the opinion of StoneX Europe Ltd.