



Gold, Nasdaq Outlook: Dip-Buying Opportunities in Focus
Gold, Nasdaq Outlook: Steep sell-offs have redirected market focus toward dip-buying opportunities, particularly in sectors aligned with primary trends. Precious metals and technology, notably gold and the Nasdaq, remain key areas of interest.
Share this:

Key Events
- Gold attracted buying interest from the 4,400 level, realigning gains toward the 4,700 area.
- Nasdaq prices drew dip-buying interest near the 25,000 level, although downside risks persist amid AI-related cost concerns.
- U.S. NFP data on Friday is expected to inject volatility across dollar pairs, precious metals, and U.S. indices, keeping structural patterns and key levels in focus.
Steep trends across gold and silver triggered profit-taking, forced liquidations, and margin increases, driving prices more than 1,000 points lower from the parabolic 5,600 high. This sell-off contributed to a broader market momentum correction, aligned with the dollar’s sharp rebound from the 96 level, ongoing geopolitical negotiations, and hawkish Fed election concerns.

In line with rising AI-spending worries, the primary trends across metals and technology continue to attract dip-buying interest on short term drawdowns. Current areas of interest include Nasdaq near 25,000, gold near 4,400, and silver near 70. Long-term forecasts for gold remain directed toward the 10,000 threshold; however, elevated volatility risks are expected to persist alongside these primary multi year uptrends.
U.S. Indices
U.S. indices face drawdown risks not only from policy fatigue and heightened sensitivity to geopolitical and tariff concerns, but also from growing fears that AI spending has outpaced monetization, turning AI from a growth catalyst into a potential margin and cash-flow risk unless returns materialize. This has realigned the Nasdaq, S&P 500, and Dow below their brief 2026 highs.
Gold Outlook: Month Time Frame – Log Scale
Source: Tradingview
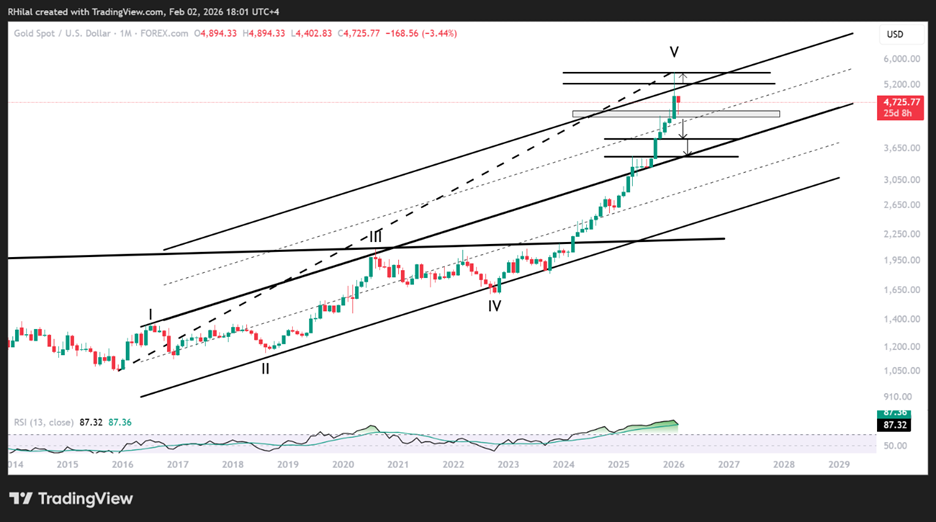
Tracking the trend from the 2016 lows to the 2026 highs, gold recently traced a pullback aligning with the 0.272 Fibonacci retracement, where dip-buying interest lifted prices back above the 4,700 level. Volatility remains elevated in this zone, with upside bias above 4,930 and 5,200, and downside risk below 4,550 and 4,380. A break lower could expose losses toward the 4,000 psychological level, followed by 3,500, a former five-month resistance zone in 2025.
Price action has also moved back within the bounds of a duplicated 10-year channel, increasing near-term selling pressure risks while longer-term, multi-year forecasts continue to target the 10,000 level.
Nasdaq Outlook: Weekly Time Frame – Log Scale
Source: Trading view
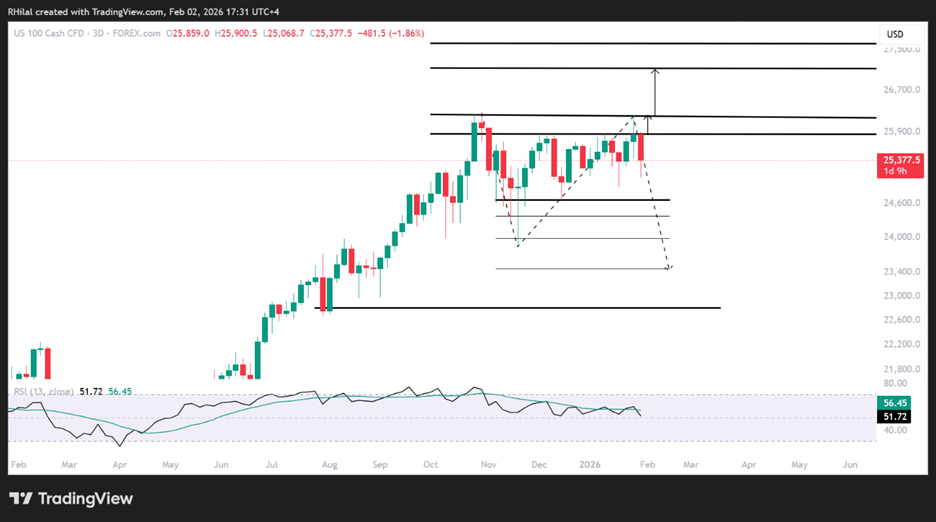
Nasdaq is challenging the 25,000–24,900 zone, which could expose deeper drawdowns toward 23,900 and 23,400, extending a three-legged correction from the October 2025 high before the broader bull trend resumes. A sustained hold above 25,500 and 25,900 is needed to realign gains toward record levels near 26,300, and potentially the 27,000 threshold.
Following the sharp momentum seen between late 2025 and early 2026, markets may be entering a mean-reversion phase — a classic pattern often observed after the Christmas rally and New Year effect, typically unfolding into February and March. High-time-frame levels remain critical in defining longer-term structural shifts amid fast-moving, headline-driven markets.
Written by Razan Hilal, CMT
Follow on X: @Rh_waves
Related tags:
Latest market news




The complete CFD trading experience
Award-winning platforms, competitive spreads, low commissions and dedicated support.
We live and breathe the markets and are dedicated to helping traders realise their ambitions as we continue to set the industry bar.
Economic calendar
Web Trader platform
Our sophisticated web-based platform is packed with features.
Related articles
US Dollar Short-term Outlook: USD Four-Week Rally Stalls Below Key Resistance 10 8 2026
DXY is holding in a tight range beneath major resistance as traders await the next catalyst from inflation expectations and Fed repricing.

Gold Bounces From Lows But Are Brighter Days Ahead?
Gold put in a sizable underside wick on the daily chart yesterday and this speaks to the possibility of near-term bottoming in the metal following a strong sell-off over the past six weeks.


Canadian Dollar Technical Outlook: USD/CAD Five-Week Rally Sets Up Major Breakout Test 10 8 2026
USD/CAD is holding near fresh yearly highs, with a tight October range keeping the focus on a potential breakout through major resistance.
StoneX Europe Ltd may make third party material available on this website which may contain information included but not limited to the conditions of financial markets. The material is for information purposes only and does not contain, and should not be construed as containing, investment advice and/or investment recommendation and/or an investment research and/or an offer of or solicitation for any transactions in financial instruments; any decision to enter into a specific transaction shall be made by the client following an assessment by him/her of their situation.
StoneX Europe Ltd makes no representation or warranty and assumes no liability as to the accuracy or completeness of the information provided, nor any loss arising from any investment based on a recommendation, forecast or other information supplied. You should always seek independent advice as to your suitability to speculate in any related markets and your ability to assume the associated risks, if you are at all unsure. We are not under any obligation to update any such material. Any opinion made may be personal to the author and may not reflect the opinion of StoneX Europe Ltd.