





Gold Price Rally Pushes RSI Back into Overbought Territory
The price of gold climbs to a fresh record high ($3045) as it extends the advance from the start of the week.
Share this:

Gold Price Outlook: XAU/USD
The price of gold climbs to a fresh record high ($3045) as it extends the advance from the start of the week, with the rise in bullion pushing the Relative Strength Index (RSI) back into overbought territory.
Gold Price Rally Pushes RSI Back into Overbought Territory
The price of gold may continue to register fresh record highs as it carves a series of higher highs and lows, and the move above 70 in the RSI is likely to be accompanied by a further advance in the precious metal like the price action from earlier this year.
Join David Song for the Weekly Fundamental Market Outlook webinar.
David provides a market overview and takes questions in real-time. Register Here
It seems as though the ongoing transition in US trade policy is boosting the appeal of gold as it clouds the outlook for the global economy, and the threat of a trade war may keep bullion afloat as it offers an alternative to fiat-currencies.
With that said, the price of gold may continue to track the positive slope in the 50-Day SMA ($2853) as it still holds above the moving average, but the RSI may show the bullish momentum abating if it struggles to hold above 70.
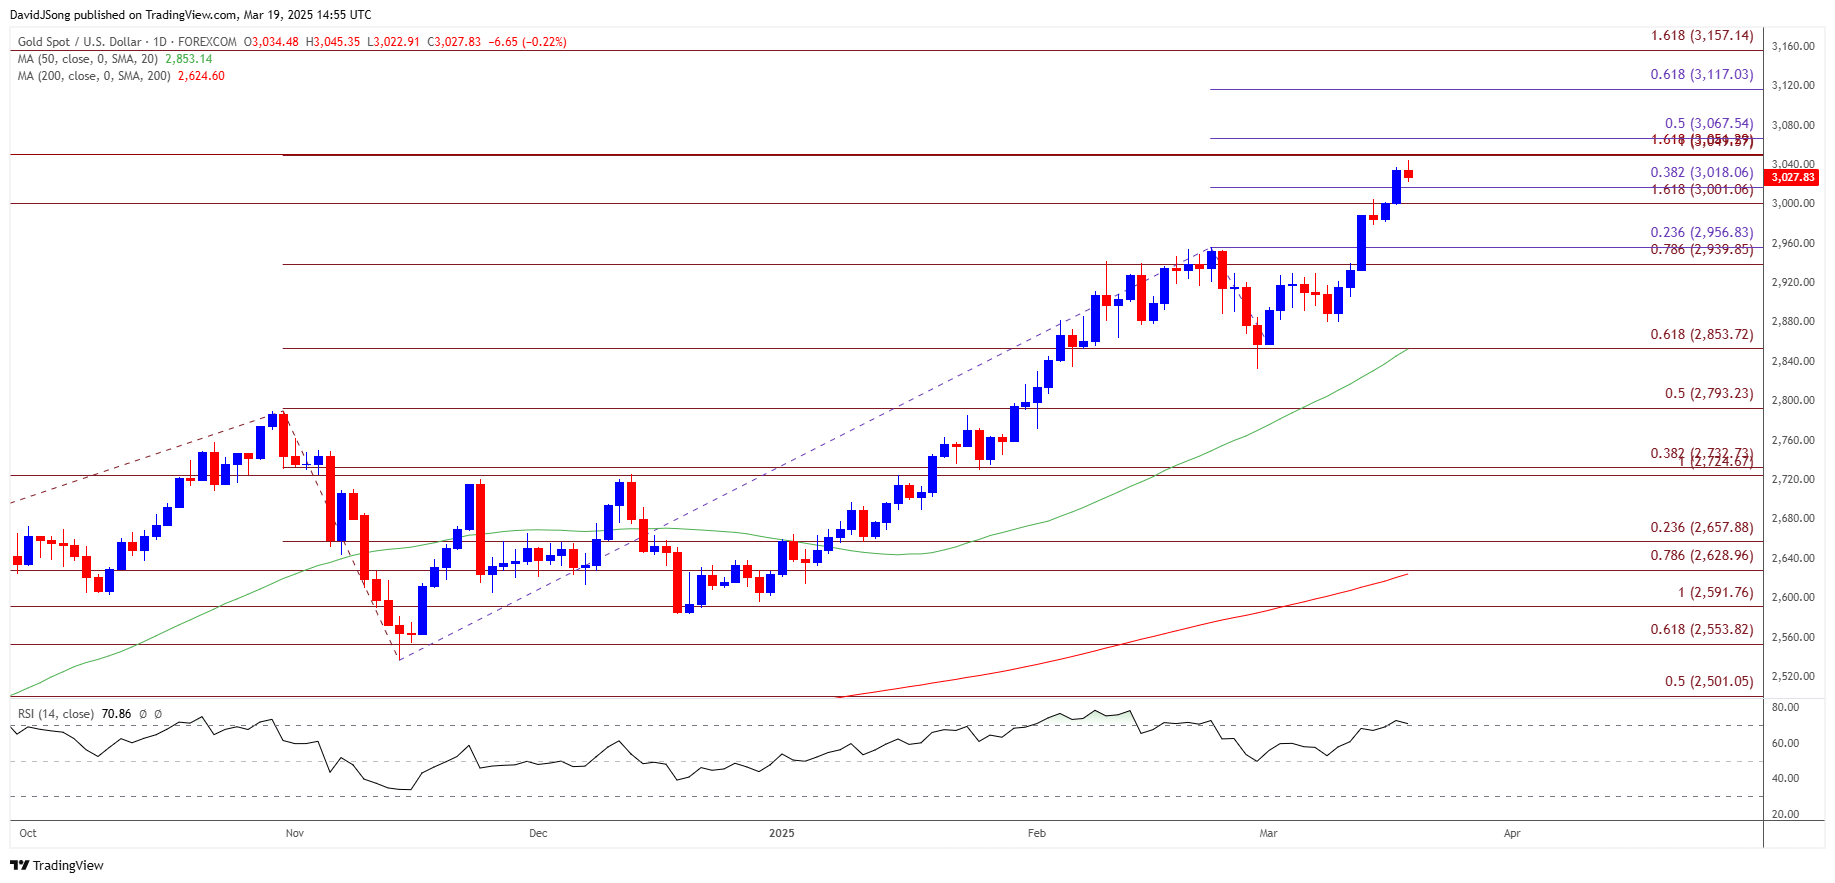
XAU/USD Price Chart – Daily
Chart Prepared by David Song, Senior Strategist; XAU/USD on TradingView
- The price of gold extends the advance from the start of the week to carve a series of higher highs and lows, and the rally in the precious metal may persist as long as the Relative Strength Index (RSI) holds above 70.
- A break/close above the $3050 (100% Fibonacci extension) to $3070 (50% Fibonacci extension) zone opens up $3120 (61.8% Fibonacci extension), with the next area of interest coming in around $3160 (161.8% Fibonacci extension) to $3190 (78.6% Fibonacci extension).
- At the same time, lack of momentum to break/close above the $3050 (100% Fibonacci extension) to $3070 (50% Fibonacci extension) zone may push the price of gold back towards the $3000 (161.8% Fibonacci extension) $3020 (38.2% Fibonacci extension) region, with the next area of interest coming in around $2940 (78.6% Fibonacci extension) to $2960 (23.6% Fibonacci extension).
Additional Market Outlooks
British Pound Forecast: GBP/USD Vulnerable to Dovish Bank of England (BoE)
Canadian Dollar Forecast: USD/CAD Coils Ahead of Reciprocal Trump Tariffs
EUR/USD Rebounds Ahead of Weekly Low to Keep RSI in Overbought Zone
USD/JPY Rebound in Focus with BoJ Expected to Hold Interest Rate
--- Written by David Song, Senior Strategist
Follow on X at @DavidJSong
Related tags:


The complete CFD trading experience
Award-winning platforms, competitive spreads, low commissions and dedicated support.
We live and breathe the markets and are dedicated to helping traders realise their ambitions as we continue to set the industry bar.
Economic calendar
Web Trader platform
Our sophisticated web-based platform is packed with features.
Related articles

Gold Update: XAU/USD Remains Under Pressure Even After the NFP Report
As the trading week comes to an end, weakness around gold price action remains evident in the short term. This can be seen in the performance of the past two sessions, where the metal has declined by approximately 0.3%. Although the move has not been particularly aggressive, it highlights that buying pressure continues to struggle to regain control of the market.

USD/CAD forecast: rally could accelerate above June highs at 1.4250
USD/CAD recovered quickly after weaker US jobs data, keeping the bullish trend in focus. A move above the June highs could accelerate the rally as inflation keeps the Fed under pressure.


Dow Jones Slide Shows What Rate Hike Bets Mean for Stocks
The Dow Jones support breakdown shows rising bond yields and rate hike bets hitting U.S. stocks while tech giants prop up the Nasdaq.
StoneX Europe Ltd may make third party material available on this website which may contain information included but not limited to the conditions of financial markets. The material is for information purposes only and does not contain, and should not be construed as containing, investment advice and/or investment recommendation and/or an investment research and/or an offer of or solicitation for any transactions in financial instruments; any decision to enter into a specific transaction shall be made by the client following an assessment by him/her of their situation.
StoneX Europe Ltd makes no representation or warranty and assumes no liability as to the accuracy or completeness of the information provided, nor any loss arising from any investment based on a recommendation, forecast or other information supplied. You should always seek independent advice as to your suitability to speculate in any related markets and your ability to assume the associated risks, if you are at all unsure. We are not under any obligation to update any such material. Any opinion made may be personal to the author and may not reflect the opinion of StoneX Europe Ltd.