





Gold Rally Stalls Below Monthly High: Is a Deeper Pullback Brewing?
Gold may fail to break the prior month’s high for the first time in 2024 — a signal that preceded a two-month retracement last year. With overbought signals flashing on higher timeframes, traders should be on alert for a potential deeper correction.
Share this:

Gold Futures (GC) Technical Analysis
It seems far more likely than not that gold will go on to print new highs this year, given the strength of its bullish trend and supporting fundamentals. However, it appears to be undergoing a much-needed correction — potentially a welcome opportunity for sidelined bulls waiting to reload at more favourable prices.
Gold Futures (GC): Monthly Chart
Gold’s parabolic trend began in March 2024, following a breakout from an inverted head and shoulders (H&S) pattern that reached its projected upside target of ~2800 within seven months. After a two-month retracement, bulls regained control, driving prices as high as 3500.
However, it now seems likely that gold will fail to take out the previous month’s high for the first time this year. With just one week of the month remaining, gold is currently on track to print a spinning top doji, having met resistance around 3400 — just beneath its all-time high (ATH).
The monthly RSI (14) remains extremely overbought, while a bearish divergence has formed in the oversold zone of the RSI (2).
Support has been found around the 23.6% Fibonacci ratio ~3140, though a break beneath it opens up a run for the 38.2% fib level near the 10-month SMA and 2900 handle.
Gold Futures (GC): Weekly and Daily Chart
Time will tell whether the monthly timeframe is in for a deeper pullback. For now, we can hone in on the weekly and daily charts for a potential near-term setup.
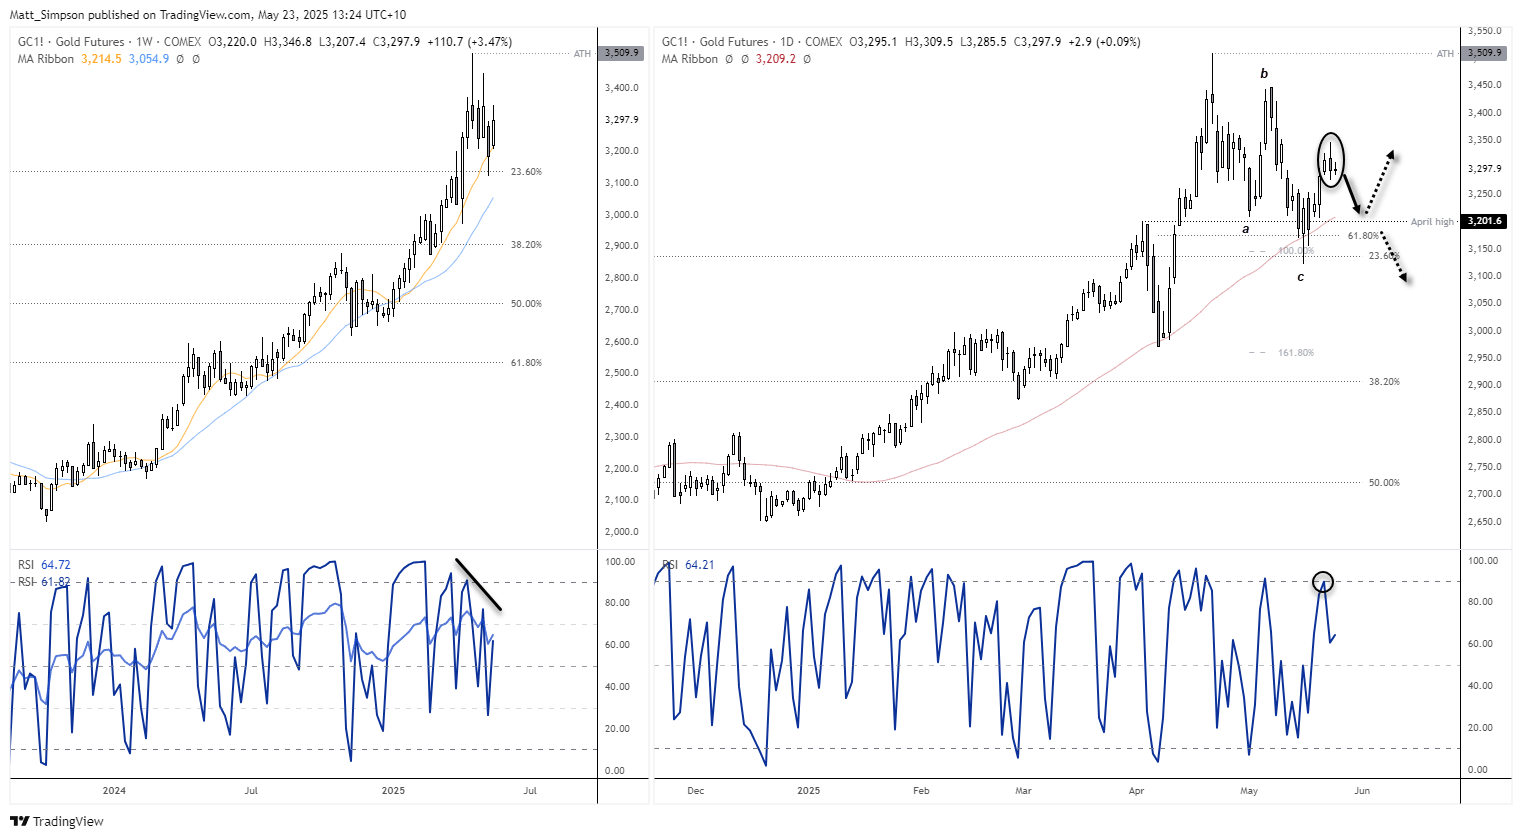
Choppier price action is already apparent on the weekly chart and has been accompanied by a bearish divergence on the RSI (2).
The daily chart shows that gold has completed the ABC correction I suggested earlier in May. The end of wave C found support near the long-term 23.6% Fibonacci retracement and the 100% projection of wave A to B. The recent closing lows also held above a smaller 61.8% Fibonacci level, suggesting that gold may not be ready to break beneath the 3180 level — at least for now.
However, a bearish outside day formed on Thursday, with the RSI (2) rising to 89.7 — nearing the typical overbought threshold of 90. This hints that a pullback toward the 50-day SMA around the 3200 handle could be on the cards in the near term.
If such a pullback occurs, how prices react around the 3180–3200 zone could offer better insight into whether the ABC correction is indeed complete (and a rally to new highs is likely), or if a deeper pullback is still yet to unfold.
-- Written by Matt Simpson
Follow Matt on Twitter @cLeverEdge
How to trade with City Index
You can trade with City Index by following these four easy steps:
- Open an account, or log in if you’re already a customer
• Open an account in the UK
• Open an account in Australia
• Open an account in Singapore
- Search for the market you want to trade in our award-winning platform
- Choose your position and size, and your stop and limit levels
- Place the trade
Related tags:
Latest market news




The complete CFD trading experience
Award-winning platforms, competitive spreads, low commissions and dedicated support.
We live and breathe the markets and are dedicated to helping traders realise their ambitions as we continue to set the industry bar.
Economic calendar
Web Trader platform
Our sophisticated web-based platform is packed with features.
Related articles
Gold Does Something it Hasn’t Done in a Year, is Larger Risk-Off Afoot?
With tech stocks getting hit harder last week there was collateral damage elsewhere, including gold as the metal closed below the $4k level for the week and that’s the first time that’s happened to spot gold in more than a year.


Silver forecast: metals liquidation drags XAG/USD into $50-55 support
Silver has broken its July low and slipped into a long-term support zone as the selling in precious metals deepens. The chart shows where the metal could bottom, and next week's Fed decision may decide whether it does.


Silver Forecast: XAG/USD Hits Fresh 2026 Lows as Selling Pressure Accelerates
Trading conditions continue to be challenging for silver in the short term. The precious metal has been losing value at an accelerated pace and, during today's session alone, has fallen more than 5.5%, reaching new lows for 2026. This development highlights how selling pressure has become increasingly dominant across recent market activity.

StoneX Europe Ltd may make third party material available on this website which may contain information included but not limited to the conditions of financial markets. The material is for information purposes only and does not contain, and should not be construed as containing, investment advice and/or investment recommendation and/or an investment research and/or an offer of or solicitation for any transactions in financial instruments; any decision to enter into a specific transaction shall be made by the client following an assessment by him/her of their situation.
StoneX Europe Ltd makes no representation or warranty and assumes no liability as to the accuracy or completeness of the information provided, nor any loss arising from any investment based on a recommendation, forecast or other information supplied. You should always seek independent advice as to your suitability to speculate in any related markets and your ability to assume the associated risks, if you are at all unsure. We are not under any obligation to update any such material. Any opinion made may be personal to the author and may not reflect the opinion of StoneX Europe Ltd.