



Hang Seng Tech's biggest hurdle is back
Every rally has failed at the same level since late 2025. Hang Seng Tech is back knocking on the door again.
Share this:

- Bulls confront stubborn 100-day moving average
- Break above 4911 shifts technical outlook
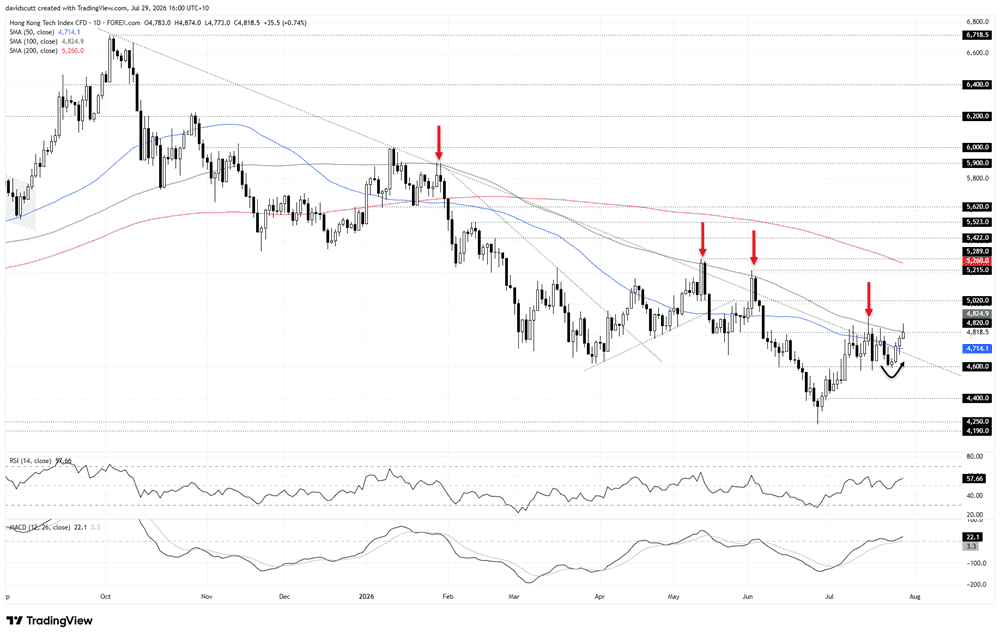
The Hang Seng Tech Index is once again testing the 100-day moving average, a level that has repeatedly acted like kryptonite for the bulls. As outlined earlier this month, every attempt to break above it since late 2025 has ultimately failed, leaving behind another lower high and reinforcing the broader bearish trend.
Again, there has been no shortage of supportive headlines this week, with CXMT's blockbuster market debut reinforcing confidence in China's semiconductor industry, while Meta chief executive Mark Zuckerberg argued in an interview with the Financial Times that the US should not ban Chinese AI models.
But as I've noted previously, the market simply isn't buying bullish narratives. Despite a steady stream of positive news in China, bulls have repeatedly failed to capitalise. However, while technical hurdles remain, that may finally be starting to change.
The index has rebounded strongly from well-established support around 4600, broken above the downtrend that's been in place since the October 2025 high and is now threatening to reclaim the 100-day moving average.
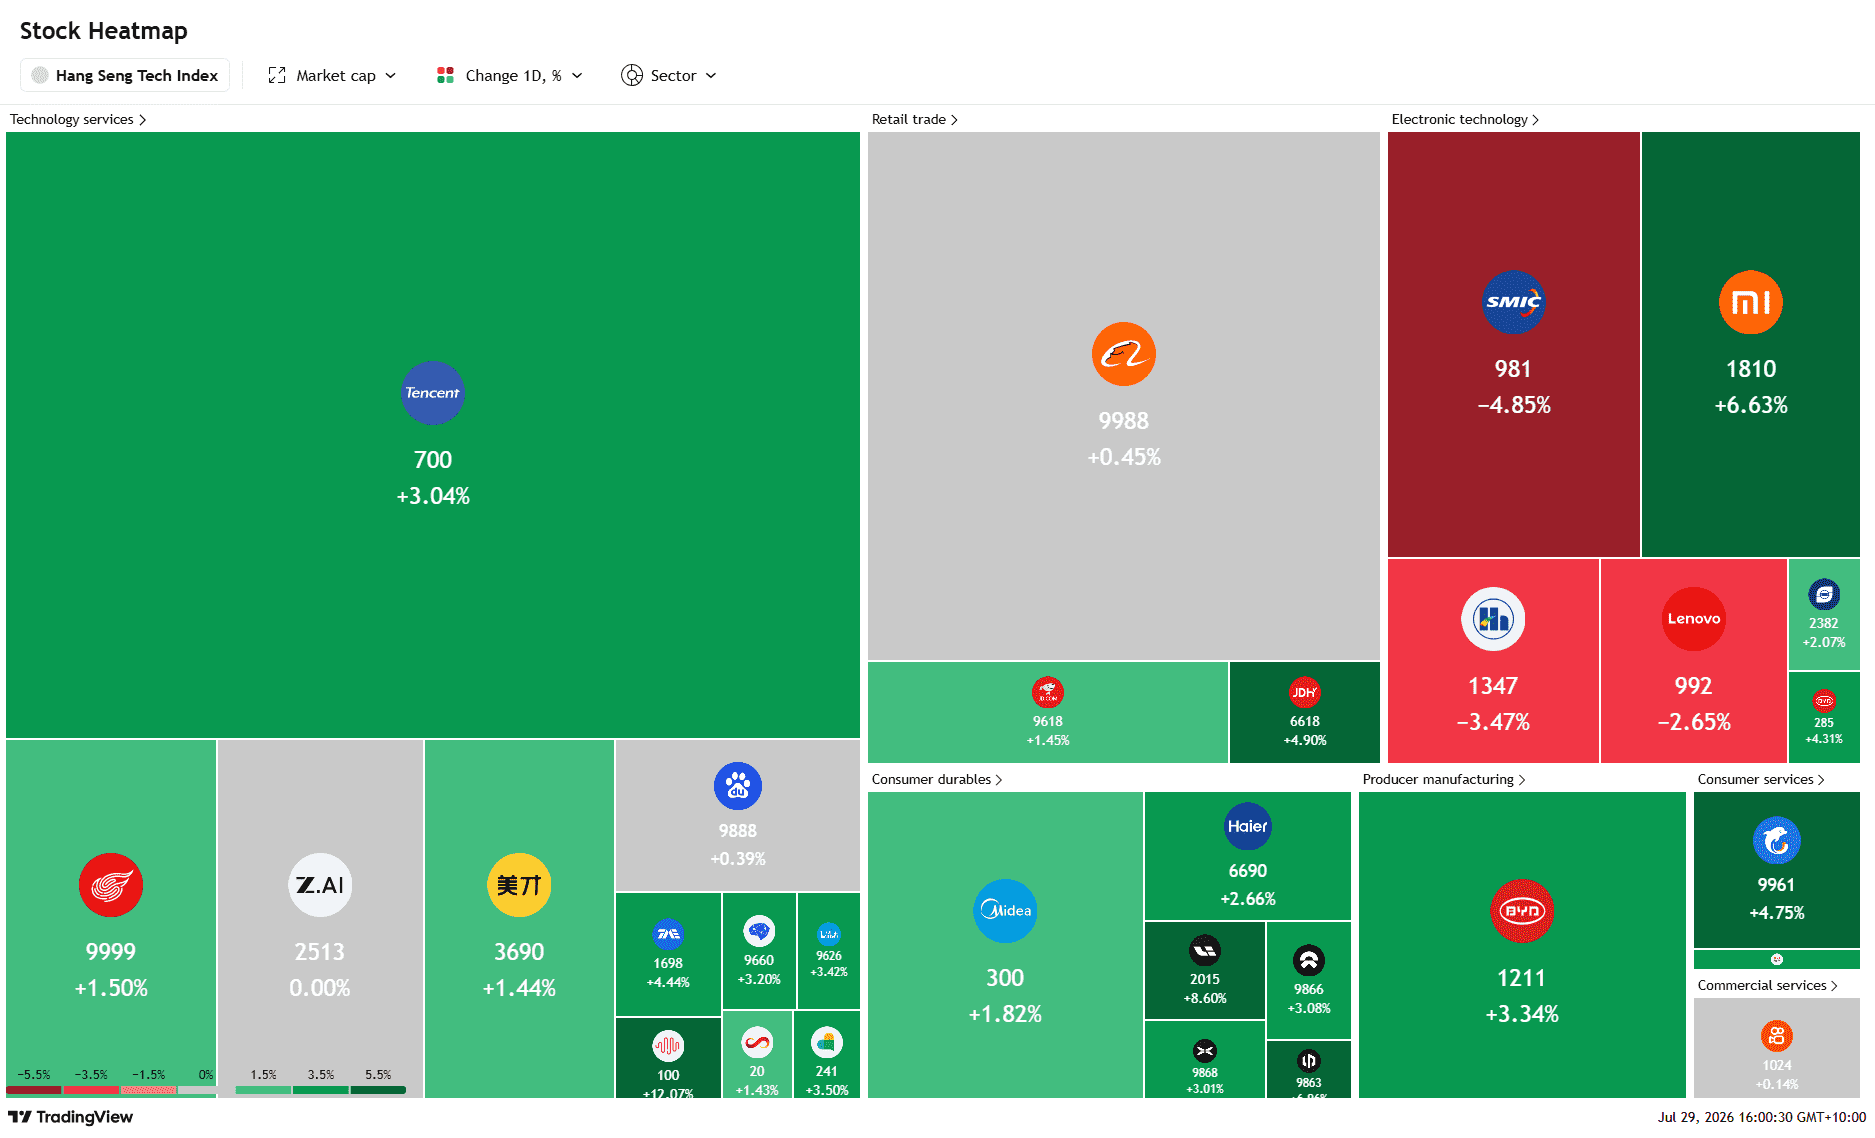
Source: TradingView
The latest advance has been led by heavyweight constituents Tencent, Xiaomi and JD.com, helping lift the broader index higher. However, weakness in semiconductor names suggests investors remain selective rather than indiscriminately bullish.
While the technical picture has improved, the burden of proof still rests with the bulls. Given the repeated failures at the 100-day moving average, I'd want to see not only a convincing close above it but also the July 16 high of 4911. A sustained break above the latter would leave the index trading at its highest level since early June, establish a higher high and provide the first real evidence that the sequence of lower highs may finally be ending.
Source: TradingView
Should that occur, attention among bulls would shift to 5020, a level that has acted as both support and resistance over recent months. Beyond, more significant swing highs at 5215 and 5289 come into focus.
However, another failure at the 100-day moving average may see the bears pounce, providing yet another opportunity to establish shorts beneath it with a stop above for protection, targeting a move back towards support at 4600.
Right now, the oscillators marginally favour the bulls. RSI (14) has pushed to a fresh high and is holding above the neutral 50 level, while MACD has crossed into positive territory and continues to diverge from its signal line. Upward momentum is slowly building, but after so many failed breakouts, the price still needs to confirm the move.
Related tags:


The complete CFD trading experience
Award-winning platforms, competitive spreads, low commissions and dedicated support.
We live and breathe the markets and are dedicated to helping traders realise their ambitions as we continue to set the industry bar.
Economic calendar
Web Trader platform
Our sophisticated web-based platform is packed with features.
Related articles
British Pound Technical Outlook: GBP/USD Bulls Fight to Stabilize at Critical Support 10 13 2026
GBP/USD is compressing into a tight near-term range just above key support, with a breakout likely to provide the next directional cue.

EUR/USD forecast: Downside risks persist despite recovery
Amid a lack of any major news, the FX markets have been largely in consolidation mode in the first half of Tuesday’s session. The US dollar eased along with bond yields and oil prices, allowing downbeat currencies like the euro to rebound modestly. With US CPI data due for release on Wednesday, don’t expect much in the way of a sharper decline in USD ahead of it. If anything, we could see the dollar buying resume, especially if crude oil prices catch a bid again amid the ongoing situation.


DAX Recovery Faces Key Test as Bulls Challenge 25,500 Resistance
The DAX continues to recover from last week's sell-off, supported by easing energy concerns and improving short-term momentum. While buyers have regained control of the four-hour trend, the index is now approaching a critical resistance zone between 25,450 and 25,600. A decisive break higher would strengthen the bullish case and open the door toward 25,800, while failure at resistance could quickly revive downside pressure.

StoneX Europe Ltd may make third party material available on this website which may contain information included but not limited to the conditions of financial markets. The material is for information purposes only and does not contain, and should not be construed as containing, investment advice and/or investment recommendation and/or an investment research and/or an offer of or solicitation for any transactions in financial instruments; any decision to enter into a specific transaction shall be made by the client following an assessment by him/her of their situation.
StoneX Europe Ltd makes no representation or warranty and assumes no liability as to the accuracy or completeness of the information provided, nor any loss arising from any investment based on a recommendation, forecast or other information supplied. You should always seek independent advice as to your suitability to speculate in any related markets and your ability to assume the associated risks, if you are at all unsure. We are not under any obligation to update any such material. Any opinion made may be personal to the author and may not reflect the opinion of StoneX Europe Ltd.