



How Have US Elections Impacted the Stock Market?
Broad stock market indices like the S&P 500 usually rise, regardless of who is in office.
Share this:

The following article is an excerpt from our FREE US Election Guide that analyzes how US Presidential elections have historically impacted the US dollar, stock market, and gold that we are republishing the in the run-up to the inauguration on January 20th. Please click the link above for more election analysis!
How Have US Elections Impacted the Stock Market?
Before delving too deeply into the specifics, it’s important to remember one key fact when analyzing the impact of US elections on the stock market: Broad stock market indices like the S&P 500 usually rise, regardless of who is in office.
Since 1961, the S&P 500 has generally seen positive returns across presidential terms, with Richard Nixon and George W. Bush being the only two exceptions in the last 60+ years:
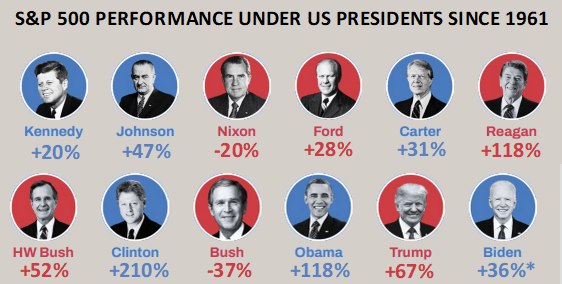
Source: StoneX. TradingView Data.
Past performance is no guarantee of future results. Data includes the price-only return of the S&P 500, excluding dividends. *Biden Presidency returns though the end of Q1 2024.
In other words, while some readers may be tempted to dramatically adjust their portfolio or trading strategy based on their political beliefs about the chief resident of 1600 Pennsylvania Avenue, it’s important to remember that hundreds of millions of Americans (and billions of citizens around the globe) will still wake up the next day and trudge off to work, contributing to continued profitability and innovation at the large companies that make up the stock market.
Getting a bit more granular, many analysts have identified a potential 4-year Presidential Cycle, where stock market returns have historically been lower in the first half of a President’s term before relatively strong third and fourth years in office. The general explanation for this theory is that when a newly-elected President takes office, he often focuses on fulfilling campaign promises around non-economic priorities like social welfare issues before pivoting back to boosting the economy to bolster his chances of getting re-elected (or getting members of his party re-elected).
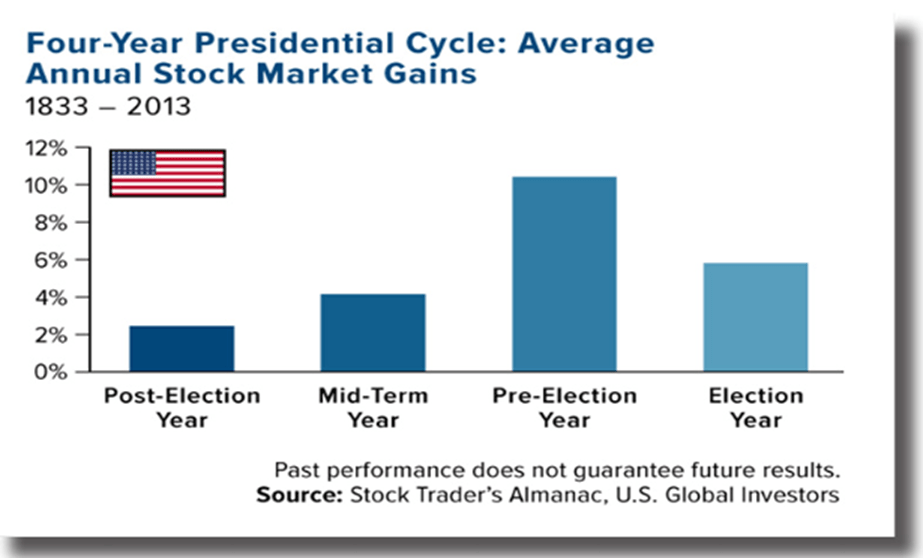
Source: Stock Trader’s Almanac, US Global Investors. Past performance is no guarantee of future results.
As the chart above shows, the S&P 500’s long-term track record displays this pattern, though it’s worth noting that, like many published market anomalies, the relationship has been less clear in recent years:
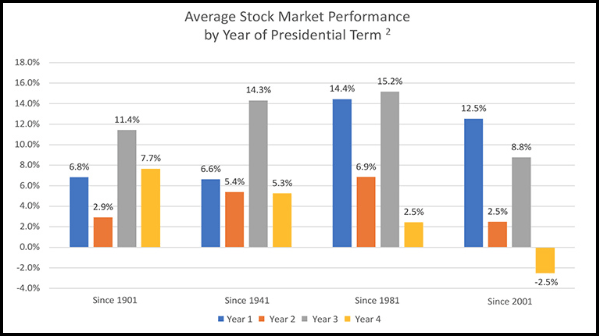
Source: WT Wealth Management. Past performance is no guarantee of future results.
Of course, the President isn’t the only relevant politician in the country – looking at which party controls Congress can also be informative for traders. Perhaps not surprisingly, under both Democratic and Republican Presidents, the best annualized returns for the S&P 500 have been realized under a divided Congress, where one party controls the House or Senate and the other party holds a majority in the second chamber:
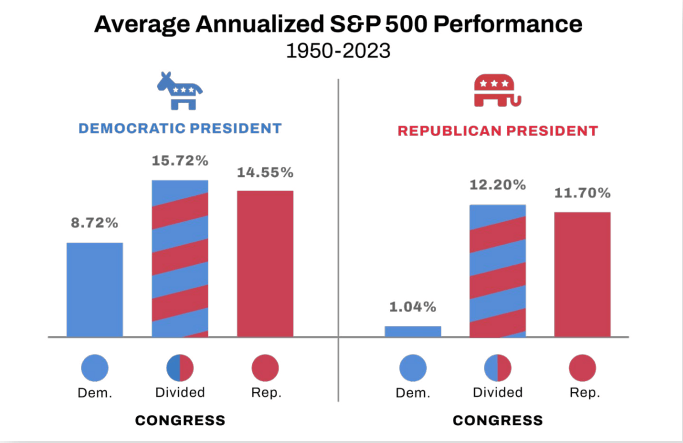
Source: YCharts. Past performance is no guarantee of future results.
Historically, the S&P 500 has also seen lower returns on average during periods when Democrats have held majorities in both the House of Representative and the Senate, though the market has generally seen positive returns regardless of the composition of the national government.
While it may be beneficial to keep these historical patterns in the back of your mind, more immediate policy, geopolitical, and valuation considerations tend to be more potent drivers for stock market performance.
The following article is an excerpt from our FREE US Election Guide that analyzes how US Presidential elections have historically impacted the US dollar, stock market, and gold that we are republishing the in the run-up to the inauguration on January 20th. Please click the link above for more election analysis!
Related tags:
Latest market news




The complete CFD trading experience
Award-winning platforms, competitive spreads, low commissions and dedicated support.
We live and breathe the markets and are dedicated to helping traders realise their ambitions as we continue to set the industry bar.
Economic calendar
Web Trader platform
Our sophisticated web-based platform is packed with features.
Related articles

Dollar Tests a Cliff’s Edge as Gold Challenges $3,870 Support
Dollar, Gold Outlook: The dollar is testing a critical 10-month trendline, while gold is challenging its 2026 low and support near $3,870. The U.S. elections, nonfarm payrolls and bond yields are key volatility catalysts to watch this week.

US Midterm Forecast: The Key Risks for Traders to Watch Through the US Elections
Prediction markets are pricing in nearly 75% odds of a Democratic sweep in this week’s US midterm elections, a development that would result in a split from the single party Republican rule of the past two years - what will it mean for markets?

Brazil Elections: Is Investor Confidence Beginning to Fade?
One of the most relevant events for emerging markets in recent sessions has been the outcome of Brazil’s presidential election. Following Lula da Silva’s victory in the second round, investor sentiment began to deteriorate noticeably. This can be observed in both the iShares MSCI Brazil ETF and the VanEck Brazil Small-Cap ETF, two important benchmarks for tracking the Brazilian equity market, both of which have posted declines of more than 15% at the start of the week.
StoneX Europe Ltd may make third party material available on this website which may contain information included but not limited to the conditions of financial markets. The material is for information purposes only and does not contain, and should not be construed as containing, investment advice and/or investment recommendation and/or an investment research and/or an offer of or solicitation for any transactions in financial instruments; any decision to enter into a specific transaction shall be made by the client following an assessment by him/her of their situation.
StoneX Europe Ltd makes no representation or warranty and assumes no liability as to the accuracy or completeness of the information provided, nor any loss arising from any investment based on a recommendation, forecast or other information supplied. You should always seek independent advice as to your suitability to speculate in any related markets and your ability to assume the associated risks, if you are at all unsure. We are not under any obligation to update any such material. Any opinion made may be personal to the author and may not reflect the opinion of StoneX Europe Ltd.