



Indices weekly outlook: Stocks enter correction territory
Markets took a proper hit on Friday, and we could see futures gap lower on Monday, barring a surprise de-escalation in the Iran conflict
Share this:

Markets took a proper hit on Friday, and we could see futures gap lower on Monday, barring a surprise de-escalation in the Iran conflict. As a result of last week’s drop, the Nasdaq 100 has now tipped into correction territory, down more than 10% from its most recent peak. A lot of the unease is tied to the ongoing tensions in the Middle East. With the situation showing little sign of easing, investors are starting to price in a more worrying scenario: persistently higher oil prices feeding through into inflation and, ultimately, weighing on global growth. That concern was reflected in energy markets, where crude oil pushing above $100. As Iran’s move to turn tankers away from the Strait of Hormuz adding fuel to the fire. As a result, inflation expectations are pushing higher, which in turn makes it harder to argue for near-term rate cuts from the Federal Reserve or any other major central banks around the world. Unsurprisingly, global bond yields have been edging higher.
It is all about crude oil and Middle East tensions
Yes, we do have lots of data from the US this coming week, culminating with the release of non-farm payrolls report on Friday, but none of that matters right now as all the focus remains on the Middle East. Worrying for stock market bulls, Donald Trump appears to be losing his grip on market sentiment. Investors are no longer taking his statements at face value. If anything, markets ignoring his comments. Towards the end of last week, Trump suggested he was easing plans to strike Iran’s energy infrastructure. However, the market response was far more muted compared to Monday’s sharp sell-off in oil and equities, when he first floated the idea of a ceasefire. This suggests markets are becoming increasingly numb to Trump’s rhetoric. His credibility is at stake, especially when you consider Isreal continuing to strike Iran despite the extension of the US ceasefire announcement. Iran, meanwhile, appears willing to use higher oil prices as leverage in negotiations. If tensions escalate further, we’re likely looking at significantly higher oil prices in the coming days.
S&P 500 technical analysis
The S&P 500 continues to form lower highs, maintaining its downward trend. This increases the risk of a deeper correction. Several key support levels have already given way. One of the most important levels was the November low, at 6507. This level was tested multiple times last week before breaking below it on Monday. Despite a brief recovery following Trump’s comments on Monday, the market sold off again and this time broken below that level more decisively on Thursday, before the selling accelerated on Friday.
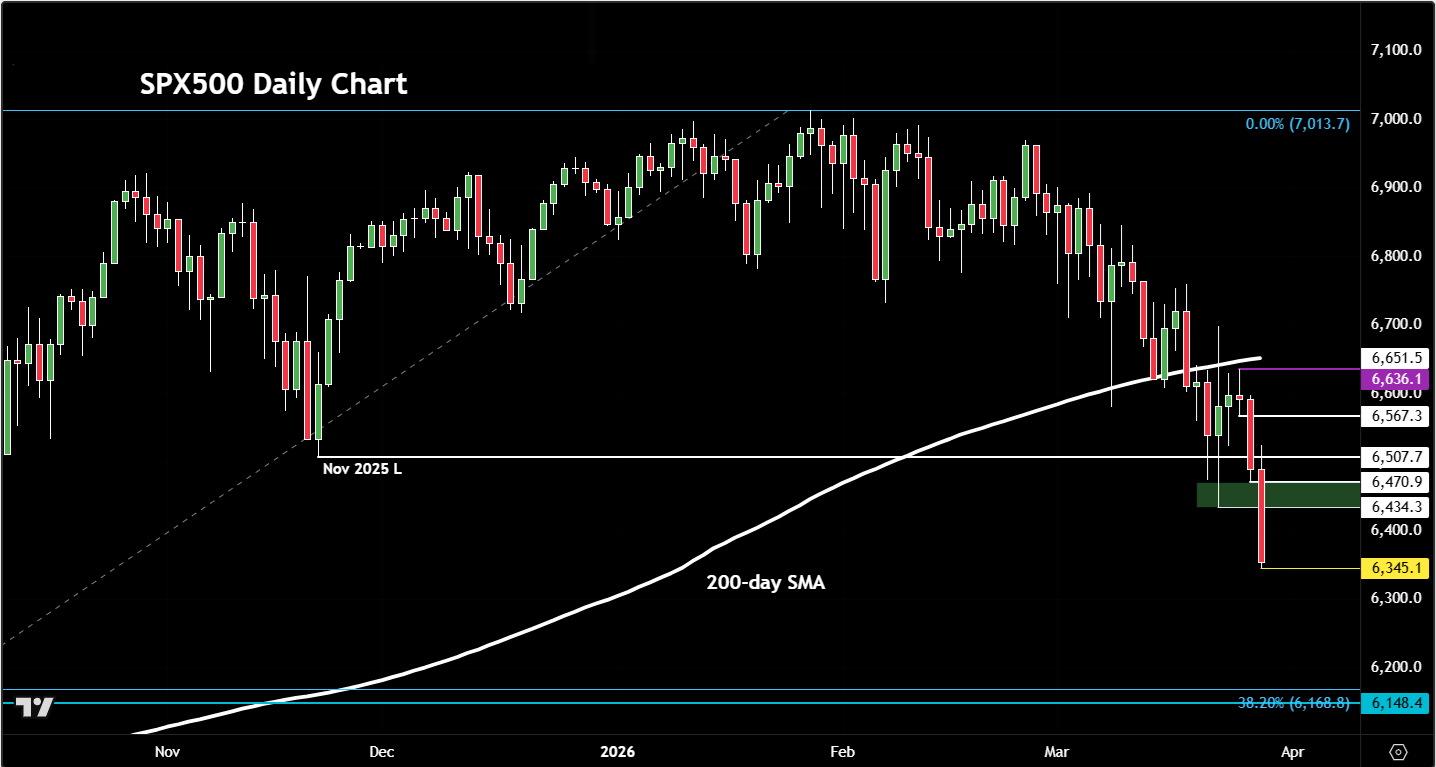
In the week ahead, we will have lots of broken levels to keep an eye on where we could see the selling pressure resume on the back of any further jawboning from Trump. The first level of resistance is now last Monday’s low at 6434. Above that, Thursday’s low at 6470 is next, before the focus turns to the low from November. Additional resistance is seen around 6567. Any more north of that, particularly if we get a higher high above the most recent local high of 6636, would tip the balance back in the bulls’ favour.
But what if the selling continuing? Well, liquidity below last week’s lo at 6345 is the first downside objective, followed by round handles such as 6,300 and then 6,200. Below these, the old all-time high from February 2025 comes in at 6148 with the 38.2% Fibonacci level, at 6168, coming in shortly below that. These are the next obvious downside objectives, should the selling pressure continue.


-- Written by Fawad Razaqzada, Market Analyst
Follow Fawad on Twitter @Trader_F_R
How to trade with City Index
You can trade with City Index by following these four easy steps:
- Open an account, or log in if you’re already a customer
• Open an account in the UK
• Open an account in Australia
• Open an account in Singapore
- Search for the company you want to trade in our award-winning platform
- Choose your position and size, and your stop and limit levels
- Place the trade
Latest market news




The complete CFD trading experience
Award-winning platforms, competitive spreads, low commissions and dedicated support.
We live and breathe the markets and are dedicated to helping traders realise their ambitions as we continue to set the industry bar.
Economic calendar
Web Trader platform
Our sophisticated web-based platform is packed with features.
Related articles
Nasdaq 100 and DAX outlook: Global stocks likely to stay under pressure for a while
Global stock markets have started the new week on an uneasy footing for the most part, although US technology sector was staging a recovery attempt. European equities have been firmly lower in this first half of Monday’s session, with the CAC 40 and IBEX among the biggest fallers as renewed political and fiscal concerns in France weigh on sentiment. The German DAX index was also down, while US indices had given up a good chunk of their sharp overnight gains, with the Dow futures turning negative, leading to a lower cash open. The Nasdaq and S&P 500 posted decent gains at the open after last week’s heavy losses, but the recovery looks fragile given the lingering pressure on technology stocks and growing doubts about the AI investment boom.

S&P 500 Forecast: SPX rises as tech rebounds ahead of earnings
S&P 500 and the Dow Jones are set to open higher as dip buyers emerge following last week’s AI sell-off, oil prices decline and attention turns to key earnings reports this week.


Gold forecast: Metal unable to shake off macro concerns
The near-term risks remain tilted to the downside for our gold forecast. That said, continued central bank buying, haven demand and inflation hedging all mean that the longer-term outlook is still quite compelling.
StoneX Europe Ltd may make third party material available on this website which may contain information included but not limited to the conditions of financial markets. The material is for information purposes only and does not contain, and should not be construed as containing, investment advice and/or investment recommendation and/or an investment research and/or an offer of or solicitation for any transactions in financial instruments; any decision to enter into a specific transaction shall be made by the client following an assessment by him/her of their situation.
StoneX Europe Ltd makes no representation or warranty and assumes no liability as to the accuracy or completeness of the information provided, nor any loss arising from any investment based on a recommendation, forecast or other information supplied. You should always seek independent advice as to your suitability to speculate in any related markets and your ability to assume the associated risks, if you are at all unsure. We are not under any obligation to update any such material. Any opinion made may be personal to the author and may not reflect the opinion of StoneX Europe Ltd.