



Investors hope for more stimulus following weak China growth (A50, CNH)
Fundamentals point to further weakness for the Chinese economy, and that has been another headwind for the China A50 index. It also builds a case for a weaker yuan.
Share this:

China’s economy beat expectations and grew by 4.8% y/y in Q1 according to data by NBS (National Bureau of Statistics). Yet the news is bitter-sweet as leading indicators and lockdowns point to weaker growth in Q2. For example, both the services and manufacturing sectors are contracting according to NBS and Caixin PMI reports, and large-scale lockdowns means that earlier rounds of fiscal support (such as tax cuts and tax rebates) have not done enough to support the economy.
Read our guide on the PBOC (People's Bank of China) and inflation
Read our guide on the PBOC (People's Bank of China) and inflation


Earlier this week the PBOC (People’s Bank of China) unveiled measures aimed at helping people and companies affected by Covid, although initial feedback suggests the measures are quite small relative to the size of the problem. That said, today it was reported that the PBOC held a meeting with CBIRC (China Banking and Regulatory Commission) to discuss financial assistance for the real economy although details are yet to be announced. But with Beijing continuing to crackdown on industry sectors as part of the ‘common prosperity’ initiative, it has done little to help equities. We can see in the above table that 8 of the top 10 stocks in the China A50 remains near their 1-year lows.
China A50 set to break lower?
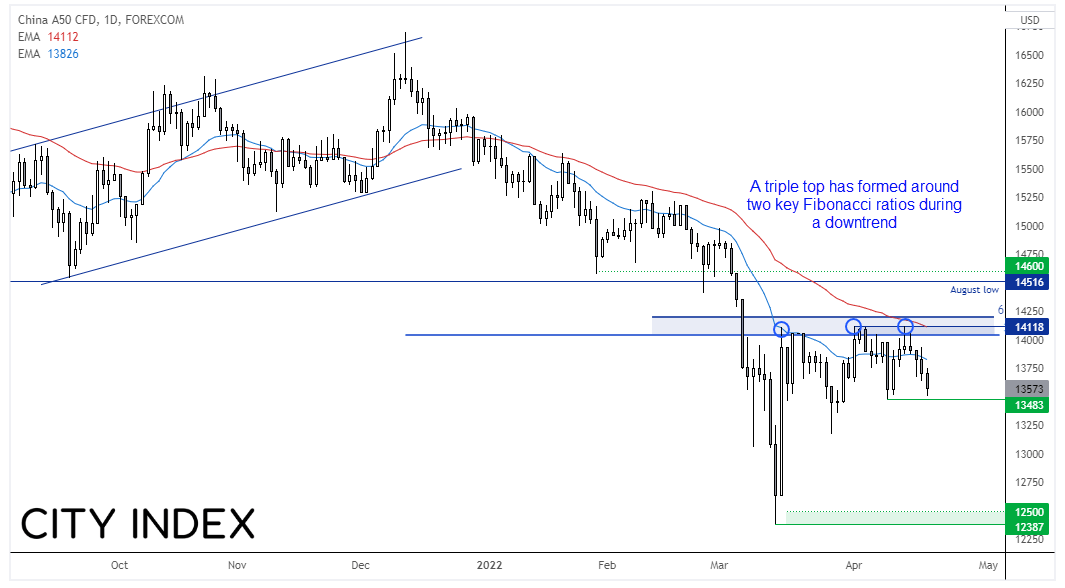
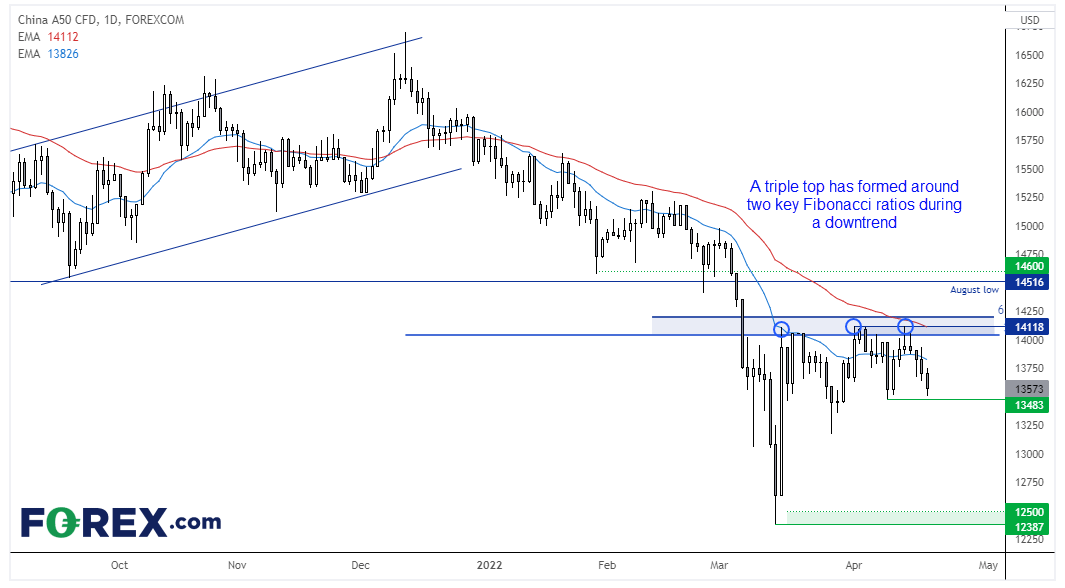
The underperformance of mega-cap stocks means we retain our bearish bias for the China A50 index. The index has been in a strong downtrend since the February 2021 high and its recent retracement has met resistance at two key Fibonacci ratios. The 50-day eMA has capped as resistance and a triple top has formed around the Fibonacci zone. Momentum has recently turned lower, so it is possible the corrective high was at 14,118. Form here we want to see a break (or daily close) below 13,480 to assume a resumption of its downtrend.
Is China ready to let their currency slide?

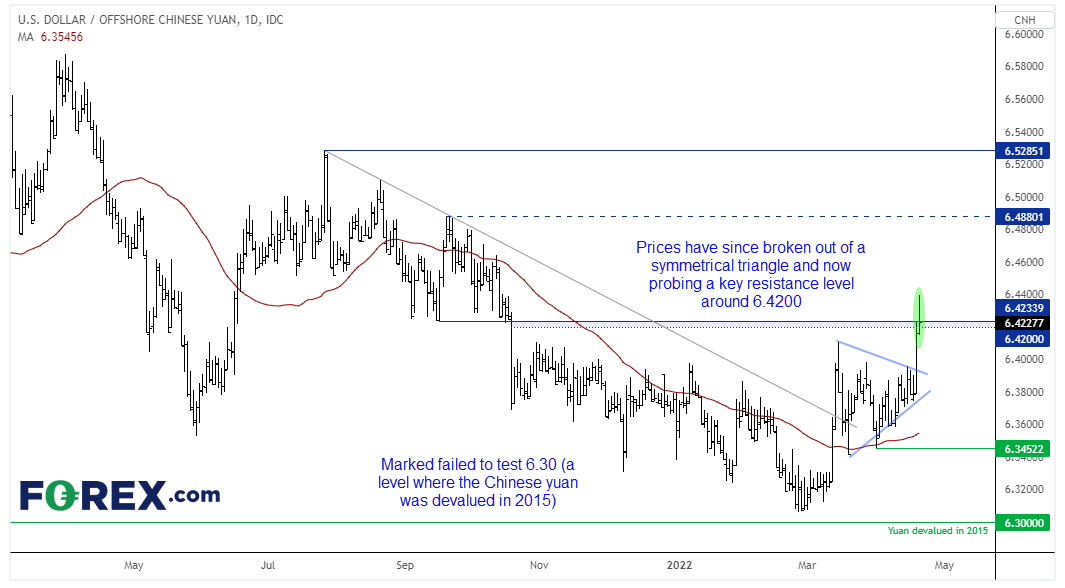
From a currency perspective it makes more sense for China to let their currency weaken. We made a case for a strong rally on USD/CNH and today we have seen prices break above 6.42 resistance, so this could be the early part of the multi-month rally we discussed in mid-March.
Notice how the market didn’t quite reach the 6.3000 level, which is when the yuan was devalued in 2015. We have since seen an initial burst higher followed by a period of consolidation, before prices broke out of a triangle pattern yesterday.
How to trade with City Index
You can trade easily trade with City Index by using these four easy steps:
- Open an account, or log in if you’re already a customer
• Open an account in the UK
• Open an account in Australia
• Open an account in Singapore
- Search for the company you want to trade in our award-winning platform
- Choose your position and size, and your stop and limit levels
- Place the trade
How to trade with FOREX.com
Follow easy steps to start trading with FOREX.com today:
- Open a Forex.com account, or log in if you’re already a customer.
- Search for the pair you want to trade in our award-winning platform.
- Choose your position and size, and your stop and limit levels.
- Place the trade.
Latest market news




The complete CFD trading experience
Award-winning platforms, competitive spreads, low commissions and dedicated support.
We live and breathe the markets and are dedicated to helping traders realise their ambitions as we continue to set the industry bar.
Economic calendar
Web Trader platform
Our sophisticated web-based platform is packed with features.
Related articles
Silver's bullish breakout case builds as bond yields retreat
The Democratic blue wave has sent crude and Treasury yields sharply lower, improving the outlook for precious metals. With gold already breaking higher, could silver be next?
Swiss Franc Short-term Outlook: USD/CHF Selloff Nears Critical Support Ahead of NFP 11 4 2026
USD/CHF bears are closing in on critical trend support, with the next reaction likely to determine whether the October decline has further to run.

US Midterm Fallout: What Does the “Blue Tsunami” Mean for the S&P 500?
Democrats made sweeping gains in the US midterm elections, winning control of both the House and Senate - what does it mean for the S&P 500 and the AI trade?

StoneX Europe Ltd may make third party material available on this website which may contain information included but not limited to the conditions of financial markets. The material is for information purposes only and does not contain, and should not be construed as containing, investment advice and/or investment recommendation and/or an investment research and/or an offer of or solicitation for any transactions in financial instruments; any decision to enter into a specific transaction shall be made by the client following an assessment by him/her of their situation.
StoneX Europe Ltd makes no representation or warranty and assumes no liability as to the accuracy or completeness of the information provided, nor any loss arising from any investment based on a recommendation, forecast or other information supplied. You should always seek independent advice as to your suitability to speculate in any related markets and your ability to assume the associated risks, if you are at all unsure. We are not under any obligation to update any such material. Any opinion made may be personal to the author and may not reflect the opinion of StoneX Europe Ltd.