



Is it time for Big Tech to outperform?
Q2 earnings for Big Tech is right around the corner. Are traders pricing in a better outlook for Q3 than the actual results from Q2?
Share this:

Most of the big-name tech companies are due to report earnings over the next few weeks, including such names as Netflix, Amazon, and Apple.Although some company’s earnings will come in worse than Q1, it is the forward guidance that needs to be paid attention to. However, are the markets beginning to price in higher stock prices for larger tech companies in the NASDAQ 100 compared to smaller companies in the Russell 2000?
The NASDAQ 100 made an all-time high on November 22nd, 2021 at 16764.86 while forming a diamond reversal formation. Since then, the tech index has been moving lower. As of the end of February, the NASDAQ 100 continued to fall in a descending wedge formation. The expectation is that prices will breakout higher from a descending pattern. On June 16th, the index made a near-term low at 11037.21. However, on July 7th, the index broke higher out of the top of the wedge. Today, price came back to test the upper trendline of the wedge and may close above it, a sign that prices may not be ready to continue lower.

Source: Tradingview, Stone X
Trade the NASDAQ 100 now: Login or open a new account!
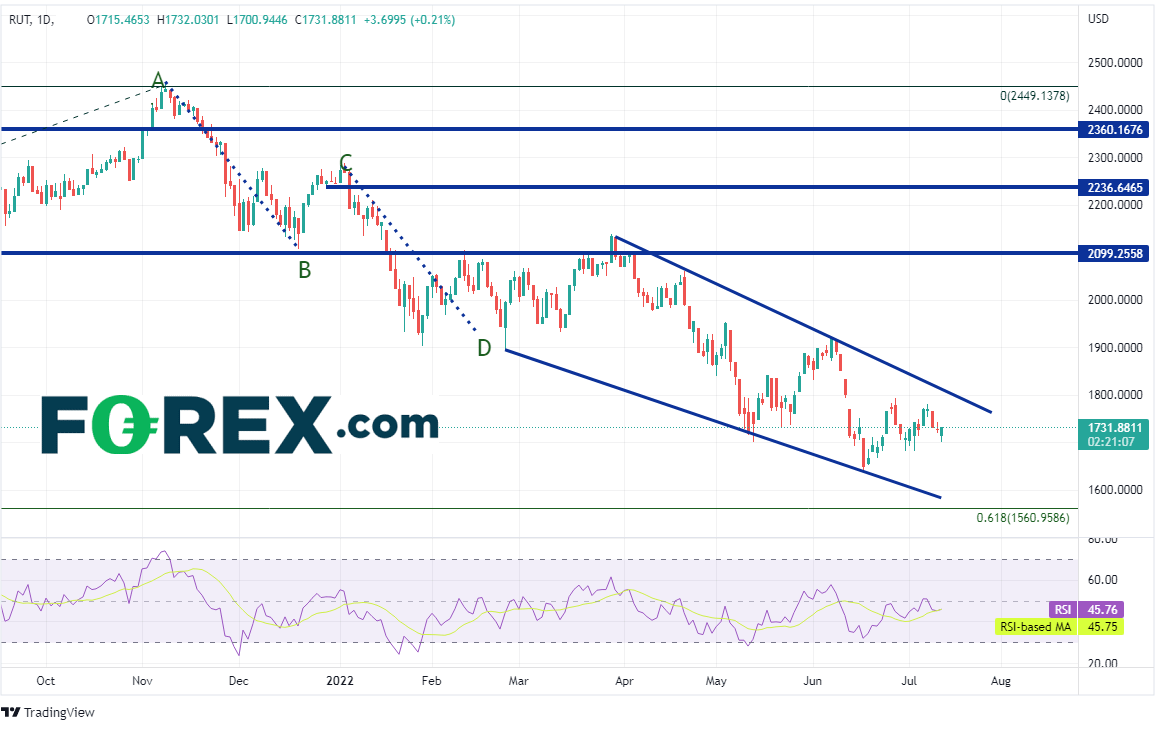
The Russell 2000 made an all-time high on November 8th, 2021, just before the NASDAQ 100. Price began moving lower in an AB=CD formation. As of the end of February, the Russell 2000 continued to move lower in a descending wedge formation. However, unlike the NASDAQ 100, the Russell 2000 has yet to break out of the pattern. The small cap index made a near-term low on June 16th and bounced. However, price could not break above the top trendline of the pattern.
Source: Tradingview, Stone X
Trade Russell 2000 now: Login or open a new account!
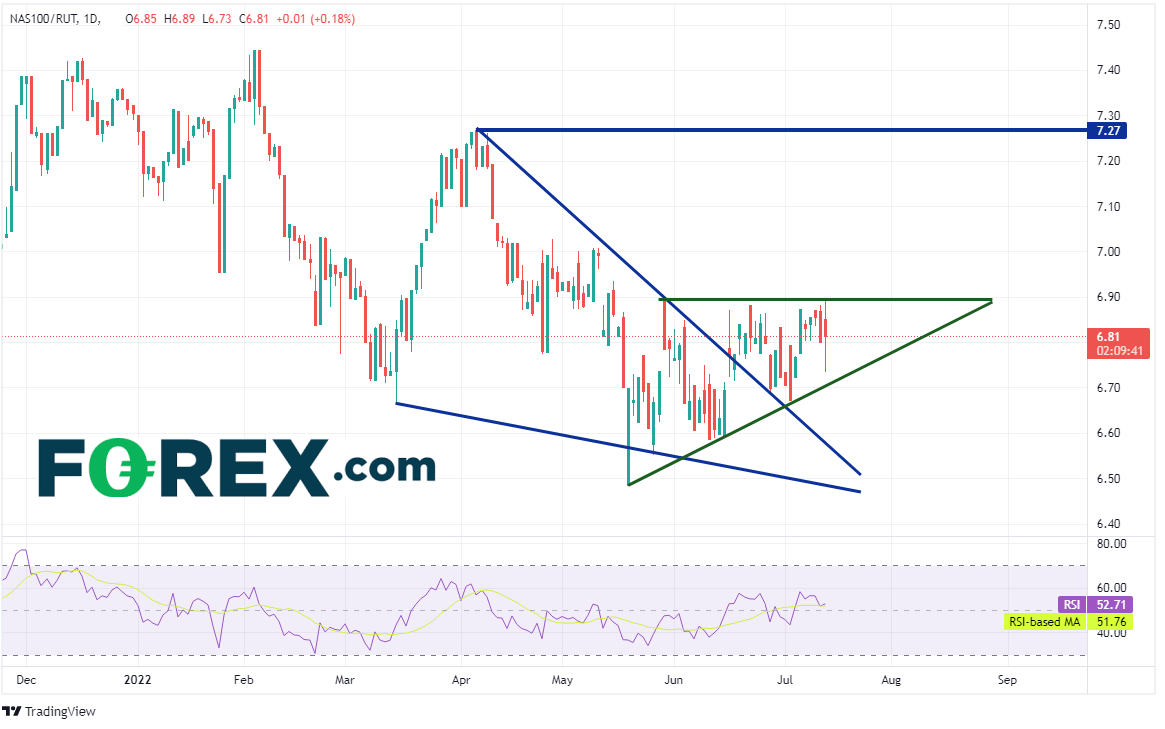
The NASDAQ 100/Russell 2000 tells us which of the two indices is performing better. When the ratio is moving higher, the NASDAQ 100 in outperforming. When the ratio is moving lower, the Russell 2000 is outperforming. The ratio made an all-time high on February 3rd, 2022 at 7.44 (just a one tick above the December 2021 highs of 7.43). Since then, the ratio has been trending lower. In early April 2022, the ratio continued moving lower in a descending wedge formation (as you may have guessed). As with the NASDAQ 100, the ratio broke above the top trendline of the formation (on June 16th), as hasn’t pulled back inside! In addition, the ratio is forming a rising triangle. Expectations are that the ratio will break out to the top side of the triangle. This tells us that since June 16th, the NASDAQ 100 has been outperforming the Russell 2000. Note that this doesn’t mean that the NASDAQ 100 is moving higher at a faster pace than the Russell 2000. It could also mean that the NASDAQ 100 is just falling at a slower pace than the Russell 2000.
Source: Tradingview, Stone X
Q2 earnings for Big Tech is right around the corner. Are traders pricing in a better outlook for Q3 than the actual results from Q2? If so, it may mean that the NASDAQ 100 outperforms the Russell 2000 and that the ratio of the two indices moves higher!
Learn more about index trading opportunities.
Most of the big-name tech companies are due to report earnings over the next few weeks, including such names as Netflix, Amazon, and Apple. Although some company’s earnings will come in worse than Q1, it is the forward guidance that needs to be paid attention to. However, are the markets beginning to price in higher stock prices for larger tech companies in the NASDAQ 100 compared to smaller companies in the Russell 2000?
The NASDAQ 100 made an all-time high on November 22nd, 2021 at 16764.86 while forming a diamond reversal formation. Since then, the tech index has been moving lower. As of the end of February, the NASDAQ 100 continued to fall in a descending wedge formation. The expectation is that prices will breakout higher from a descending pattern. On June 16th, the index made a near-term low at 11037.21. However, on July 7th, the index broke higher out of the top of the wedge. Today, price came back to test the upper trendline of the wedge and may close above it, a sign that prices may not be ready to continue lower.

Source: Tradingview, Stone X
Trade the NASDAQ 100 now: Login or Open a new account!
• Open an account in the UK
• Open an account in Australia
• Open an account in Singapore
The Russell 2000 made an all-time high on November 8th, 2021, just before the NASDAQ 100. Price began moving lower in an AB=CD formation. As of the end of February, the Russell 2000 continued to move lower in a descending wedge formation. However, unlike the NASDAQ 100, the Russell 2000 has yet to break out of the pattern. The small cap index made a near-term low on June 16th and bounced. However, price could not break above the top trendline of the pattern.

Source: Tradingview, Stone X
Trade Russell 2000 now: Login or Open a new account!
• Open an account in the UK
• Open an account in Australia
• Open an account in Singapore
The NASDAQ 100/Russell 2000 tells us which of the two indices is performing better. When the ratio is moving higher, the NASDAQ 100 in outperforming. When the ratio is moving lower, the Russell 2000 is outperforming. The ratio made an all-time high on February 3rd, 2022 at 7.44 (just a one tick above the December 2021 highs of 7.43). Since then, the ratio has been trending lower. In early April 2022, the ratio continued moving lower in a descending wedge formation (as you may have guessed). As with the NASDAQ 100, the ratio broke above the top trendline of the formation (on June 16th), as hasn’t pulled back inside! In addition, the ratio is forming a rising triangle. Expectations are that the ratio will break out to the top side of the triangle. This tells us that since June 16th, the NASDAQ 100 has been outperforming the Russell 2000. Note that this doesn’t mean that the NASDAQ 100 is moving higher at a faster pace than the Russell 2000. It could also mean that the NASDAQ 100 is just falling at a slower pace than the Russell 2000.
Source: Tradingview, Stone X
Q2 earnings for Big Tech is right around the corner. Are traders pricing in a better outlook for Q3 than the actual results from Q2? If so, it may mean that the NASDAQ 100 outperforms the Russell 2000 and that the ratio of the two indices moves higher!
Related tags:
Latest market news




The complete CFD trading experience
Award-winning platforms, competitive spreads, low commissions and dedicated support.
We live and breathe the markets and are dedicated to helping traders realise their ambitions as we continue to set the industry bar.
Economic calendar
Web Trader platform
Our sophisticated web-based platform is packed with features.
Related articles
Oil Quietly Hands the Fed a Reason to Stay Hawkish
Oil prices and the U.S. dollar are both on the front foot as elevated energy costs feed Fed warnings that inflation may prove sticky.


S&P 500 forecast: Stocks extend drop as correction risks grow
US and global equity markets have extended Wednesday’s sell-off, with Wall Street opening lower after a weak handover from Asia and Europe. The deterioration in risk appetite has been spreading across global markets. The dollar was firmer, Treasury yields were holding onto yesterday’s gains, while gold, silver and bitcoin were all under pressure alongside equities and major currencies.

Gold forecast: XAU/USD could take a larger dive after the big rise in yields
Gold prices have been falling in the last few days after last week’s post-FOMC pop faded amid rising interest rate expectations, higher oil prices and a strengthening US dollar. As before, I wasn’t convinced gold would thrive in the current macro backdrop.
StoneX Europe Ltd may make third party material available on this website which may contain information included but not limited to the conditions of financial markets. The material is for information purposes only and does not contain, and should not be construed as containing, investment advice and/or investment recommendation and/or an investment research and/or an offer of or solicitation for any transactions in financial instruments; any decision to enter into a specific transaction shall be made by the client following an assessment by him/her of their situation.
StoneX Europe Ltd makes no representation or warranty and assumes no liability as to the accuracy or completeness of the information provided, nor any loss arising from any investment based on a recommendation, forecast or other information supplied. You should always seek independent advice as to your suitability to speculate in any related markets and your ability to assume the associated risks, if you are at all unsure. We are not under any obligation to update any such material. Any opinion made may be personal to the author and may not reflect the opinion of StoneX Europe Ltd.