



Is the USD/JPY bearish move becoming ‘long’ in the tooth?
Shorting USD/JPY is not a new idea, and as the pair has erased around half of its 21-month rally, we see the potential for a bounce over the coming weeks.
Share this:

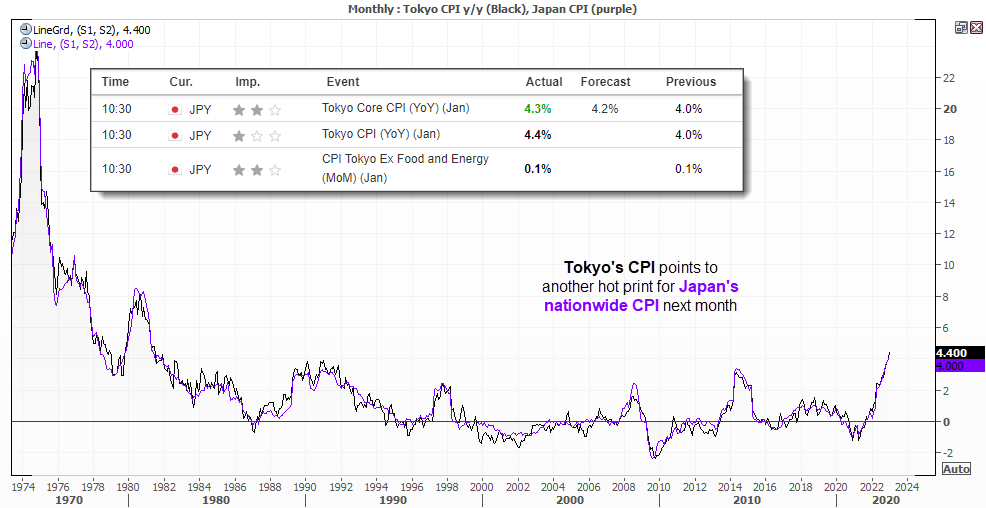
Inflation in Tokyo rose 4.4% y/y in January, its highest level since 1981. And as Tokyo inflation has a tendency to lead nationwide inflation in Japan, it suggests another hot print for Japan’s CPI in February. And that places further pressure on the BOJ to tighten policy from its ultra-easy stance, and explains why JPY is now the strongest major of the session.
However, Kuroda’s defiance and pattern of surprising markets and going against the consensus means we may not get any policy changes at his final meeting in March, and instead leave it to his successor to tighten policy, So whilst USD/JPY is lower today, we still see the potential for it to extend a countertrend move. Especially if the FOMC are more hawkish than expected next week. But a look at the chart also suggest its bearish move from the 2022 high could now have limited downside.
USD/JPY monthly chart:
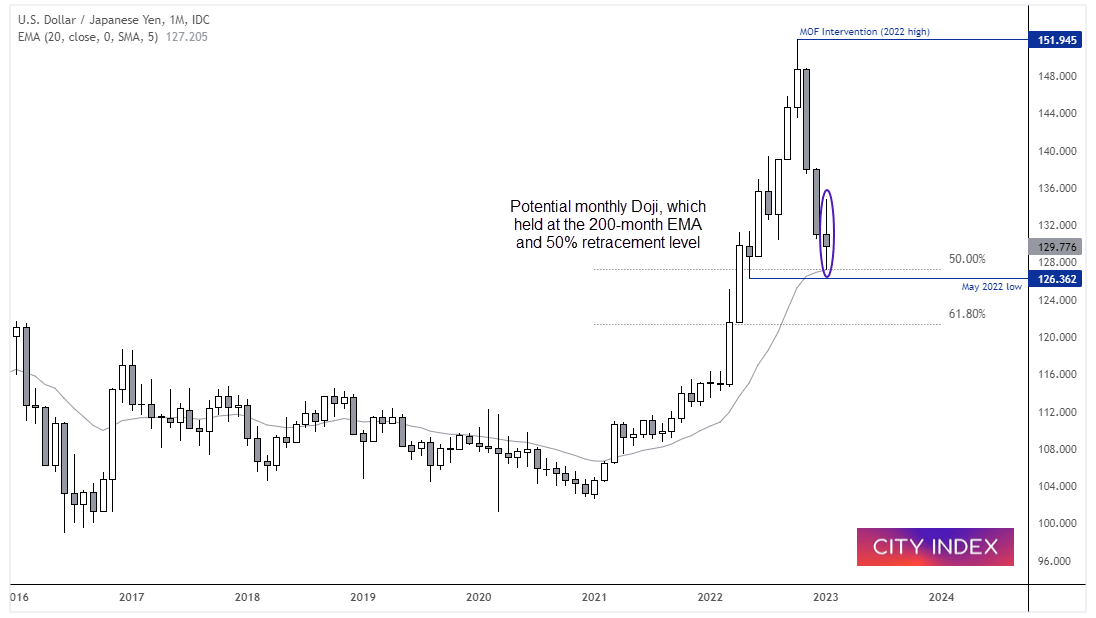
The yen is on track for its third consecutive bearish month, as it continues to retrace against its 21-month bullish rally where the pair rose over 48%. And if it were to close around current levels it would have produced a monthly Doji, which warns of weakness to the bearish move. Furthermore, this month’s low perfectly respected the 200-month EMA and 50% retracement level as support. And that begs the question as to whether we have seen an important swing low.
USD/JPY weekly chart:
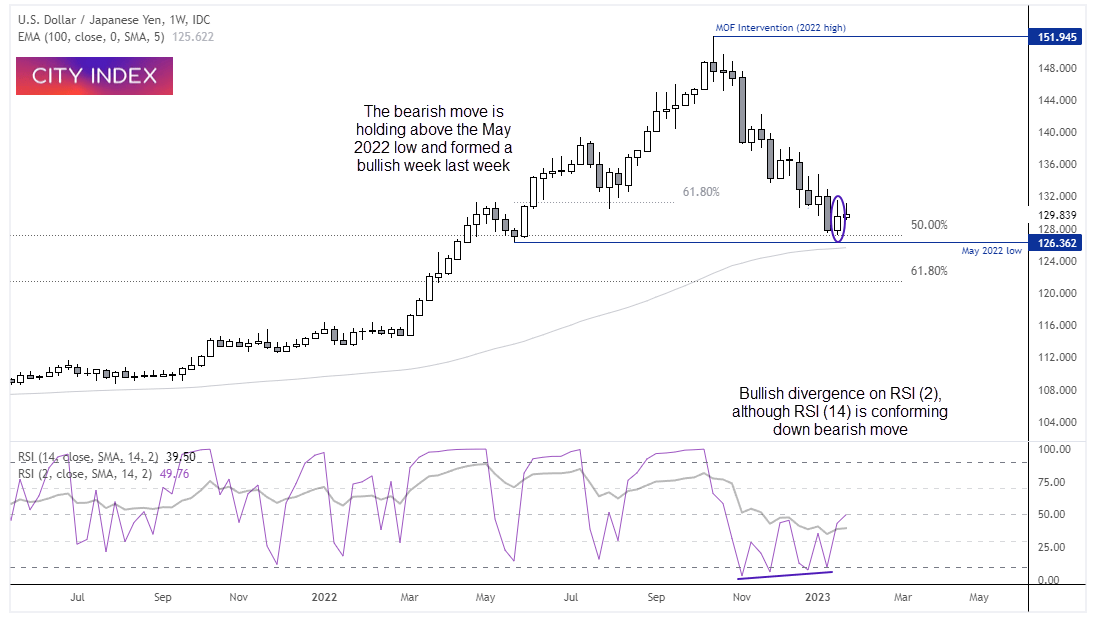
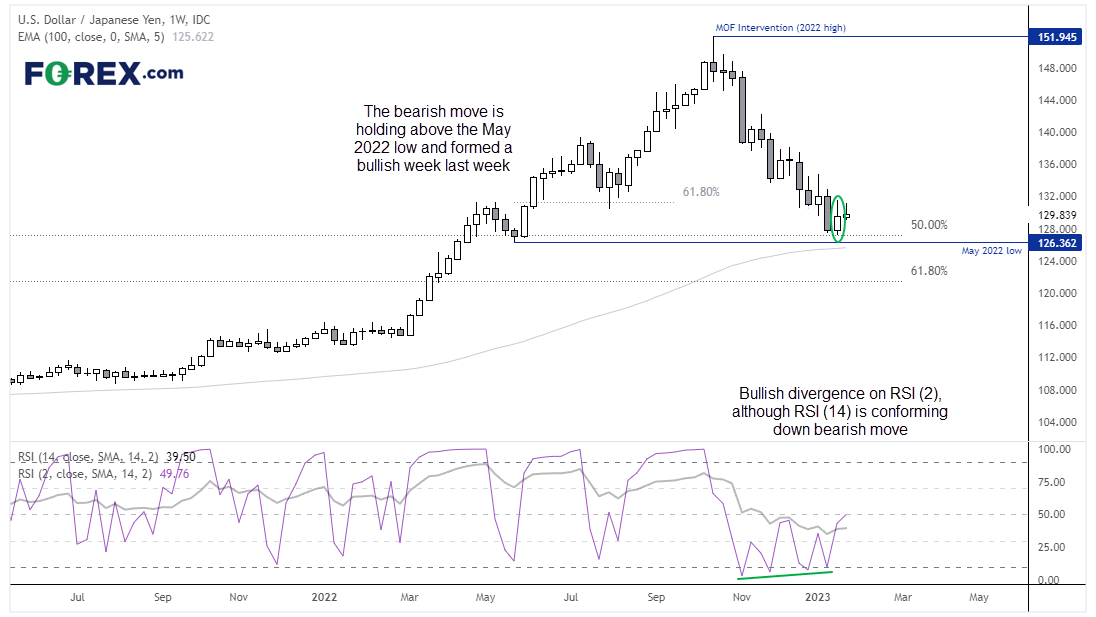
The weekly chart shows how the decline from the 2022 high is holding above the May 2022 low, and a bullish divergence is forming on RSI (2), to warn of near-term exhaustion to the downside. Yet as the RSI (14) remains below 50 and tracks prices lower without a bullish divergence, we’re on guard for a bounce higher with the potential to also break to new low further out.
USD/JPY daily chart:
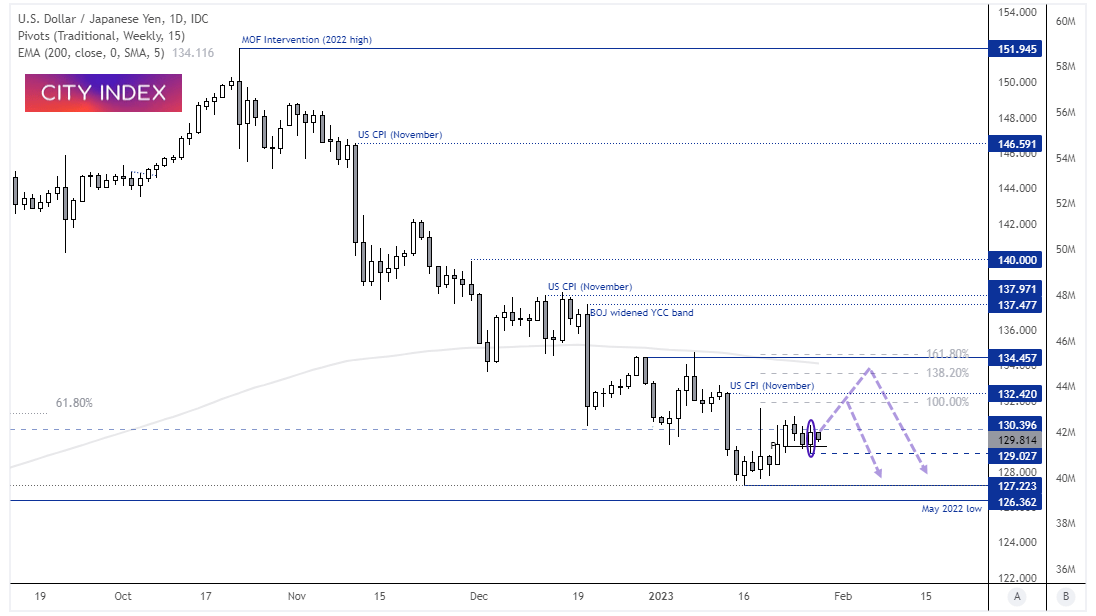
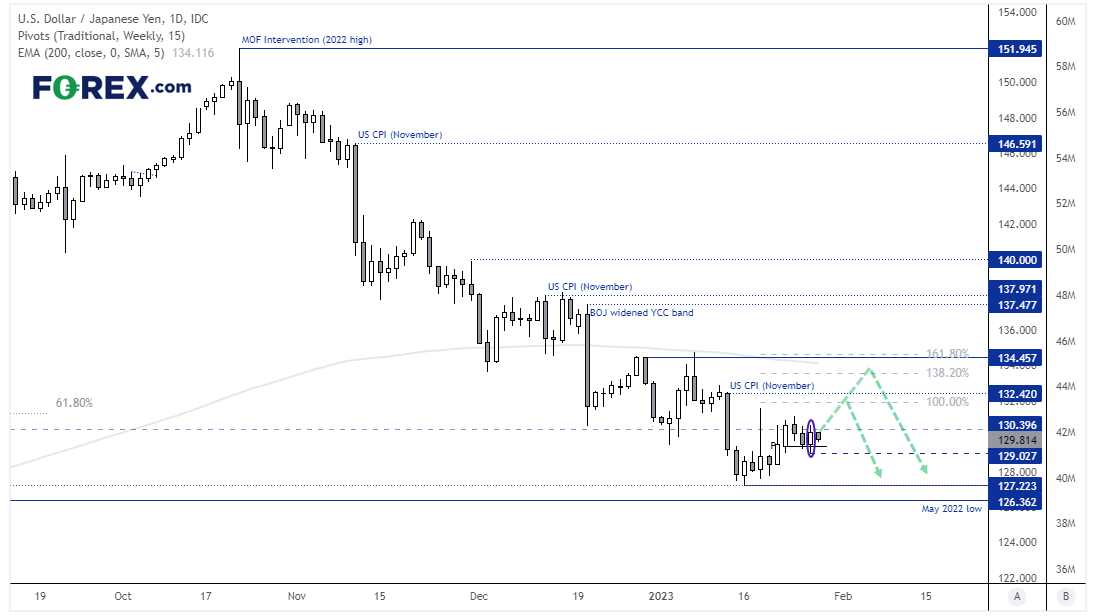
The daily chart shows an initial countertrend rally from 127.23 low briefly rose above the August low, but has since pulled back. A bullish outside day formed yesterday to suggest a swing low may have formed just above 129, and prices are pulling back within yesterday’s range – yet holding above the weekly pivot point. We’re now looking for another leg higher on the daily chart as part of its countertrend move. Whether this is simply a last leg higher of an ABC correction or something bigger remains to be seen, but overall shorting USD/JPY is not a new idea and the higher timeframes suggest the downside potential is limited.
- Over the near-term, the bias remains bullish above yesterday’s low and for a move to 132 (just below the 100% projection / wave equality).
- If the Fed are more hawkish than expected at next week’s meeting, 134 becomes a viable target near the 200-day EMA, in between the 138.2% and 161.8% Fibonacci projections.
- Over the medium-term, perhaps we could even see it return to 140 if prices remain above 127.22 (or the May 2022 low).
Related tags:

The complete CFD trading experience
Award-winning platforms, competitive spreads, low commissions and dedicated support.
We live and breathe the markets and are dedicated to helping traders realise their ambitions as we continue to set the industry bar.
Economic calendar
Web Trader platform
Our sophisticated web-based platform is packed with features.
Related articles

USD/CAD forecast: rally could accelerate above June highs at 1.4250
USD/CAD recovered quickly after weaker US jobs data, keeping the bullish trend in focus. A move above the June highs could accelerate the rally as inflation keeps the Fed under pressure.


USD Sets Fresh Yearly High as EUR/USD Drops Dramatically, USD/JPY Stable
Well, it was a week of USD strength that wasn’t entirely pushed by USD/JPY, as a strong sell-off in EUR/USD has pushed the major pair to its most oversold state in a decade.


Dow Jones Slide Shows What Rate Hike Bets Mean for Stocks
The Dow Jones support breakdown shows rising bond yields and rate hike bets hitting U.S. stocks while tech giants prop up the Nasdaq.
StoneX Europe Ltd may make third party material available on this website which may contain information included but not limited to the conditions of financial markets. The material is for information purposes only and does not contain, and should not be construed as containing, investment advice and/or investment recommendation and/or an investment research and/or an offer of or solicitation for any transactions in financial instruments; any decision to enter into a specific transaction shall be made by the client following an assessment by him/her of their situation.
StoneX Europe Ltd makes no representation or warranty and assumes no liability as to the accuracy or completeness of the information provided, nor any loss arising from any investment based on a recommendation, forecast or other information supplied. You should always seek independent advice as to your suitability to speculate in any related markets and your ability to assume the associated risks, if you are at all unsure. We are not under any obligation to update any such material. Any opinion made may be personal to the author and may not reflect the opinion of StoneX Europe Ltd.