





Japanese Yen Forecast: Does USD/JPY Have a Date with 165?
Some traders view Kanda’s “lame duck” status as a sign that Japanese policymakers may not intervene until USD/JPY reaches closer to 165.
Share this:

USD/JPY Key Points
- Japan is replacing its top currency diplomat at the end of the month.
- Some traders view Kanda’s “lame duck” status as a sign that Japanese policymakers may not intervene until USD/JPY reaches closer to 165.
- Previous resistance at 160.00 may now provide support for USD/JPY on any non-intervention dips, providing a well-defined risk level to watch for bullish traders
One of the aspects I adore about the forex market is that exchange rates are driven by a diverse set of factors depending on the market’s dominant narrative. Everything from economic growth to employment to inflation to more nebulous factors like geopolitics, natural disasters, and even the replacement of secondary policymakers can impact currency values in the right circumstances.
That last factor is certainly contributing to the continued strength in USD/JPY at the moment.
At the end of the month, Japan’s top currency diplomat, Masato Kanda, will be replaced by Japanese Finance Ministry's international bureau chief Atsushi Mimura. As any USD/JPY trader could tell you, Kanda has repeatedly intervened directly into the forex market to buy yen and sell US dollars in an effort to support Japan’s currency, both in Q4 2022 and more recently in April/May of this year to the tune of $62B…ultimately with little effect.
Traders are speculating that Kanda, now that he’s formally a “lame duck” policymaker, may be less likely to intervene again as he runs out the string on his tenure, reducing the risk of additional intervention this month. With the spread between the benchmark US interest rate and Japan’s target rate still in excess of 5%, USD/JPY’s bullish trend could extend further from here, with some traders eyeing the 165 level as the next potential area to watch before the Ministry of Finance and Bank of Japan feel compelled to step back into the market directly.
Japanese Yen Technical Analysis: USD/JPY Daily Chart
Source: StoneX, TradingView
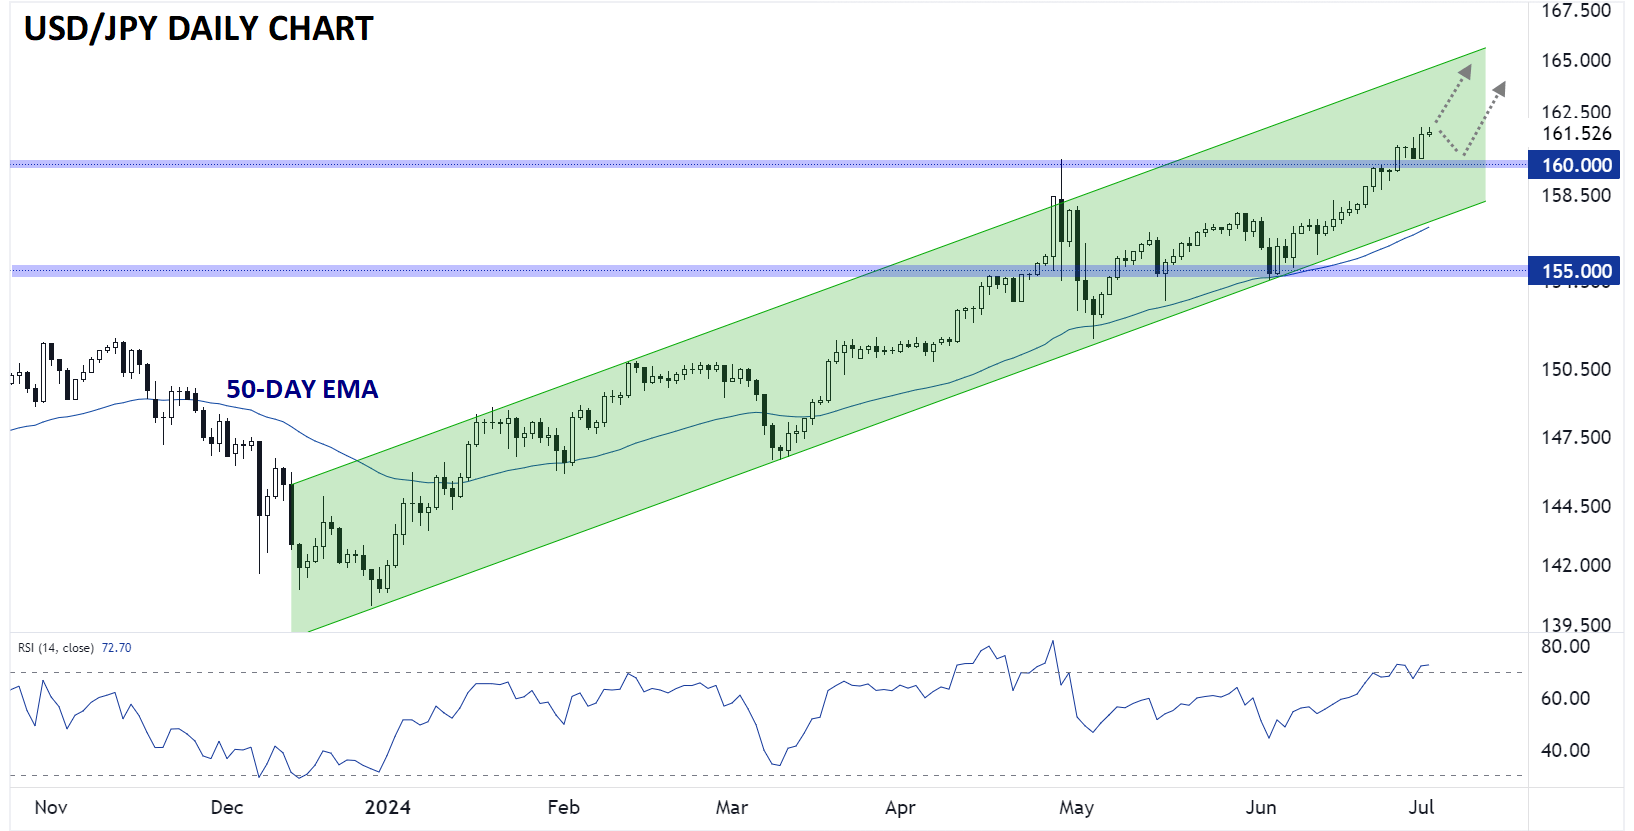
Looking at the USD/JPY chart above, the pair has been rising within a well-defined bullish channel since mid-December, and the pair currently sits near the middle of that channel. If the pair continues its rally over the next few weeks, it may reach that aforementioned 165 area before hitting the top of channel later this month.
In the short-term, previous resistance at 160.00 may now provide support for USD/JPY on any non-intervention dips, providing a well-defined risk level to watch for bullish traders.
-- Written by Matt Weller, Global Head of Research
Check out Matt’s Daily Market Update videos on YouTube and be sure to follow Matt on Twitter: @MWellerFX
Related tags:
Latest market news




The complete CFD trading experience
Award-winning platforms, competitive spreads, low commissions and dedicated support.
We live and breathe the markets and are dedicated to helping traders realise their ambitions as we continue to set the industry bar.
Economic calendar
Web Trader platform
Our sophisticated web-based platform is packed with features.
Related articles
USD/JPY Weekly Outlook: Volatility Has Left the Building
The yen has ignored broad dollar weakness, falling Treasury yields and renewed market turbulence. Yet its relationship with US interest rates remains intact. So why is USD/JPY going absolutely nowhere fast?

Swiss Franc Forecast: USD/CHF Seven-Week Rally Reverses From Yearly Highs 10 16 2026
A sharp rejection from fresh highs has shifted momentum in favor of USD/CHF bears, raising the stakes for a critical support test.


AUD/USD Bulls Fight Back After Australian Jobs Shock
AUD/USD has been hit by another ugly Australian employment report, sending RBA rate hike expectations sharply lower. Yet the relationships driving the currency have shifted since quarter-end, and improving risk appetite could provide the fuel for a recovery.
StoneX Europe Ltd may make third party material available on this website which may contain information included but not limited to the conditions of financial markets. The material is for information purposes only and does not contain, and should not be construed as containing, investment advice and/or investment recommendation and/or an investment research and/or an offer of or solicitation for any transactions in financial instruments; any decision to enter into a specific transaction shall be made by the client following an assessment by him/her of their situation.
StoneX Europe Ltd makes no representation or warranty and assumes no liability as to the accuracy or completeness of the information provided, nor any loss arising from any investment based on a recommendation, forecast or other information supplied. You should always seek independent advice as to your suitability to speculate in any related markets and your ability to assume the associated risks, if you are at all unsure. We are not under any obligation to update any such material. Any opinion made may be personal to the author and may not reflect the opinion of StoneX Europe Ltd.