



Kiwi outlook: RBNZ decision could be the catalyst for NZD/USD breakout
The RBNZ faces another big call today with markets fully priced for a 25bp cut and a sliver of risk for more. Updated rate tracks and forecasts will set the tone, but technical signals suggest the Kiwi may be ready to turn higher.
Share this:

- Markets price 25bp cut; risk of 50bp not zero
- Updated OCR track and inflation forecasts critical
- NZD/USD forming bullish signals after prolonged downtrend
- AUD/NZD momentum fading, uptrend support under pressure
Summary
The RBNZ faces another big call today with markets fully priced for a 25bp cut and a sliver of risk for more. October’s unanimous 50bp move and signals of further reductions keep the door open for a repeat, though history and 300bp of easing this cycle tilt the odds toward a smaller step. Updated tracks for rates, growth, inflation and jobs will be key, alongside any dissent in the vote split. In the absence of a shock 50bp cut, technical signals suggest directional risks for the Kiwi may be starting to lean higher against the U.S. and Australian dollars.
What the RBNZ Saw in October
The RBNZ noted inflation was “around the top of the Monetary Policy Committee’s 1 to 3 percent target band” but expected it to “return to around the 2 percent target mid-point over the first half of 2026” given spare capacity. Domestic activity “through the middle of 2025 was weak,” with house prices “flat” and investment “remain[ing] weak,” though household consumption was “recovering” as lower rates took hold. Internationally, growth among trading partners was “proving resilient, partly because of strong investment in AI-related activity,” but was forecast to “slow in 2026.” Labour market references were implicit in the discussion of spare capacity, reinforcing a softer backdrop.
Which Saw it Deliver a 50
The RBNZ cut the OCR by 50bp to 2.5%, a move agreed unanimously after weighing a smaller 25bp step. The Committee judged that spare capacity and weak mid-2025 activity would pull inflation back toward the 2% midpoint in early 2026. While household spending had started to recover and commodity prices stayed supportive, housing and investment remained soft. Inflation risks were two-sided, but the tone was clear: the Committee signalled it was open to further reductions, implying more than one cut if needed to anchor inflation near target.
Rate Track and Forecasts
Source: RBNZ
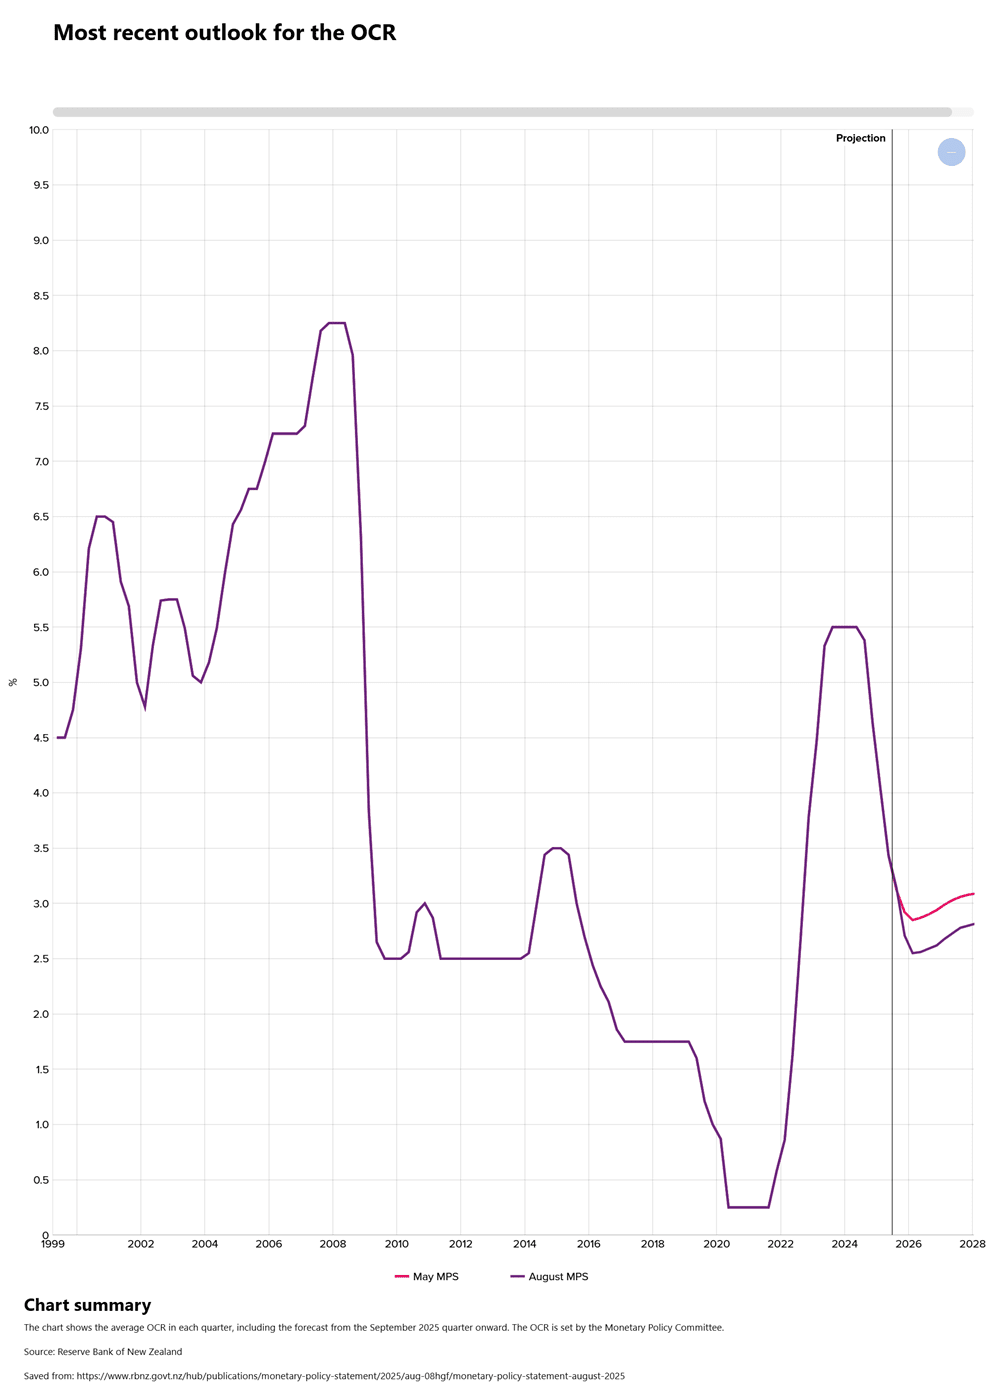
Three months ago, the RBNZ projected the OCR would bottom at 2.5% by early 2026, before hinting at tightening risks into 2027. That track now looks too high. With markets fully priced for a cut to 2.25% today, the question is whether the Committee signals a deeper trough at 2% or even below, which would imply at least one more reduction this cycle. A lower path would mark a far more stimulatory stance than before, tilting risks for updated inflation and growth forecasts higher and unemployment lower.


Prior Forecasts: Growth, Jobs and Inflation
Q2 GDP was a horror show, contracting 0.9% q/q versus the RBNZ’s prior forecast for a 0.3% decline and a flat annual rate. The slump was broad-based and left growth well below expectations. While very weak, the low base effect may see updated projections for future GDP growth nudged higher relative to three months ago. Back then, the Bank anticipated growth accelerating to a sustained annual pace of more than 2.5% by mid-2026.
The unemployment rate sat at 5.3%, the level the RBNZ previously forecast it would peak at in Q2 2025 before easing to 5% by Q3 2026. It will be worth watching how that track evolves in the latest projections because labour force participation is below the 70.4% level forecast for mid-year. That drop has kept a lid on unemployment, preventing a sharper rise. If participation rebounds faster than assumed, it could limit wage and inflationary pressures by keeping unemployment elevated for longer. Participation will therefore be a key input in today’s forecasts.
Annual CPI inflation is sitting at 3.0%, right at the top of the RBNZ’s 1–3% target band and in line with its prior forecasts. That level also marked the peak in the profile for this cycle, with the Bank previously projecting a gradual deceleration back to the 2% midpoint by Q2 2027. With price stability as its sole mandate, the trajectory for inflation remains central to policy decisions.
Market Pricing
Source: Bloomberg
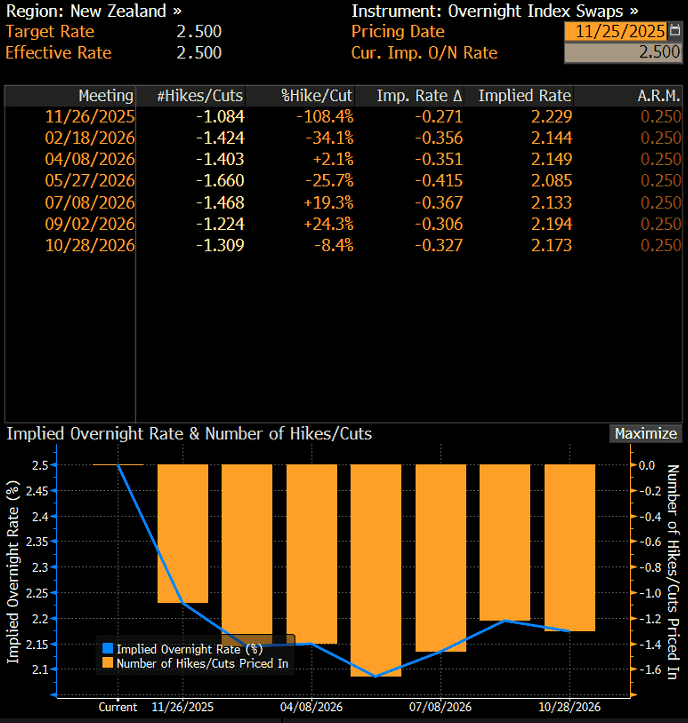
Swaps currently price 27.1bp for today’s meeting, effectively a full 25bp cut with a sliver of risk for a second. The market’s reluctance to price a 50 makes sense, but the case for a larger move is not trivial. The RBNZ delivered a 50bp cut in October and has signalled a willingness to do multiple reductions. With nearly three months until the next meeting in early 2026, why not front-load easing again?
I think the risk of another 50 is greater than pricing suggests, but history tempers conviction. At this meeting in 2024, the Bank had every excuse to deliver 75bp or more for similar reasons but opted for 50 instead. It then had to cut far more aggressively later, a misstep under the prior governor. After 300bp of cuts this cycle, that precedent tilts the odds toward a 25bp move today in my view.
Looking ahead, swaps favour another cut to 2% by May 2026, though it’s not fully priced. My base case is the OCR will trough at 2% this cycle, if not today then early next year.
What to Watch
The decision drops at 2pm Wellington (12pm Sydney), followed by outgoing Governor Christian Hawkesby’s press conference at 3pm. This will be his final meeting before handing over to Anna Breman in December, so don’t expect fireworks—he’s unlikely to rock the boat. Along with the rate decision and updated forecasts, the vote split will be a key detail. Any dissent, whether for a larger cut or no move, could matter more for New Zealand markets than the headline decision given a 25bp cut is fully priced.
Kiwi’s Tide Turning?
It’s been a tough few months for Kiwi bulls, but there are tentative signs the tide may be starting to turn against the U.S. and Australian dollars.
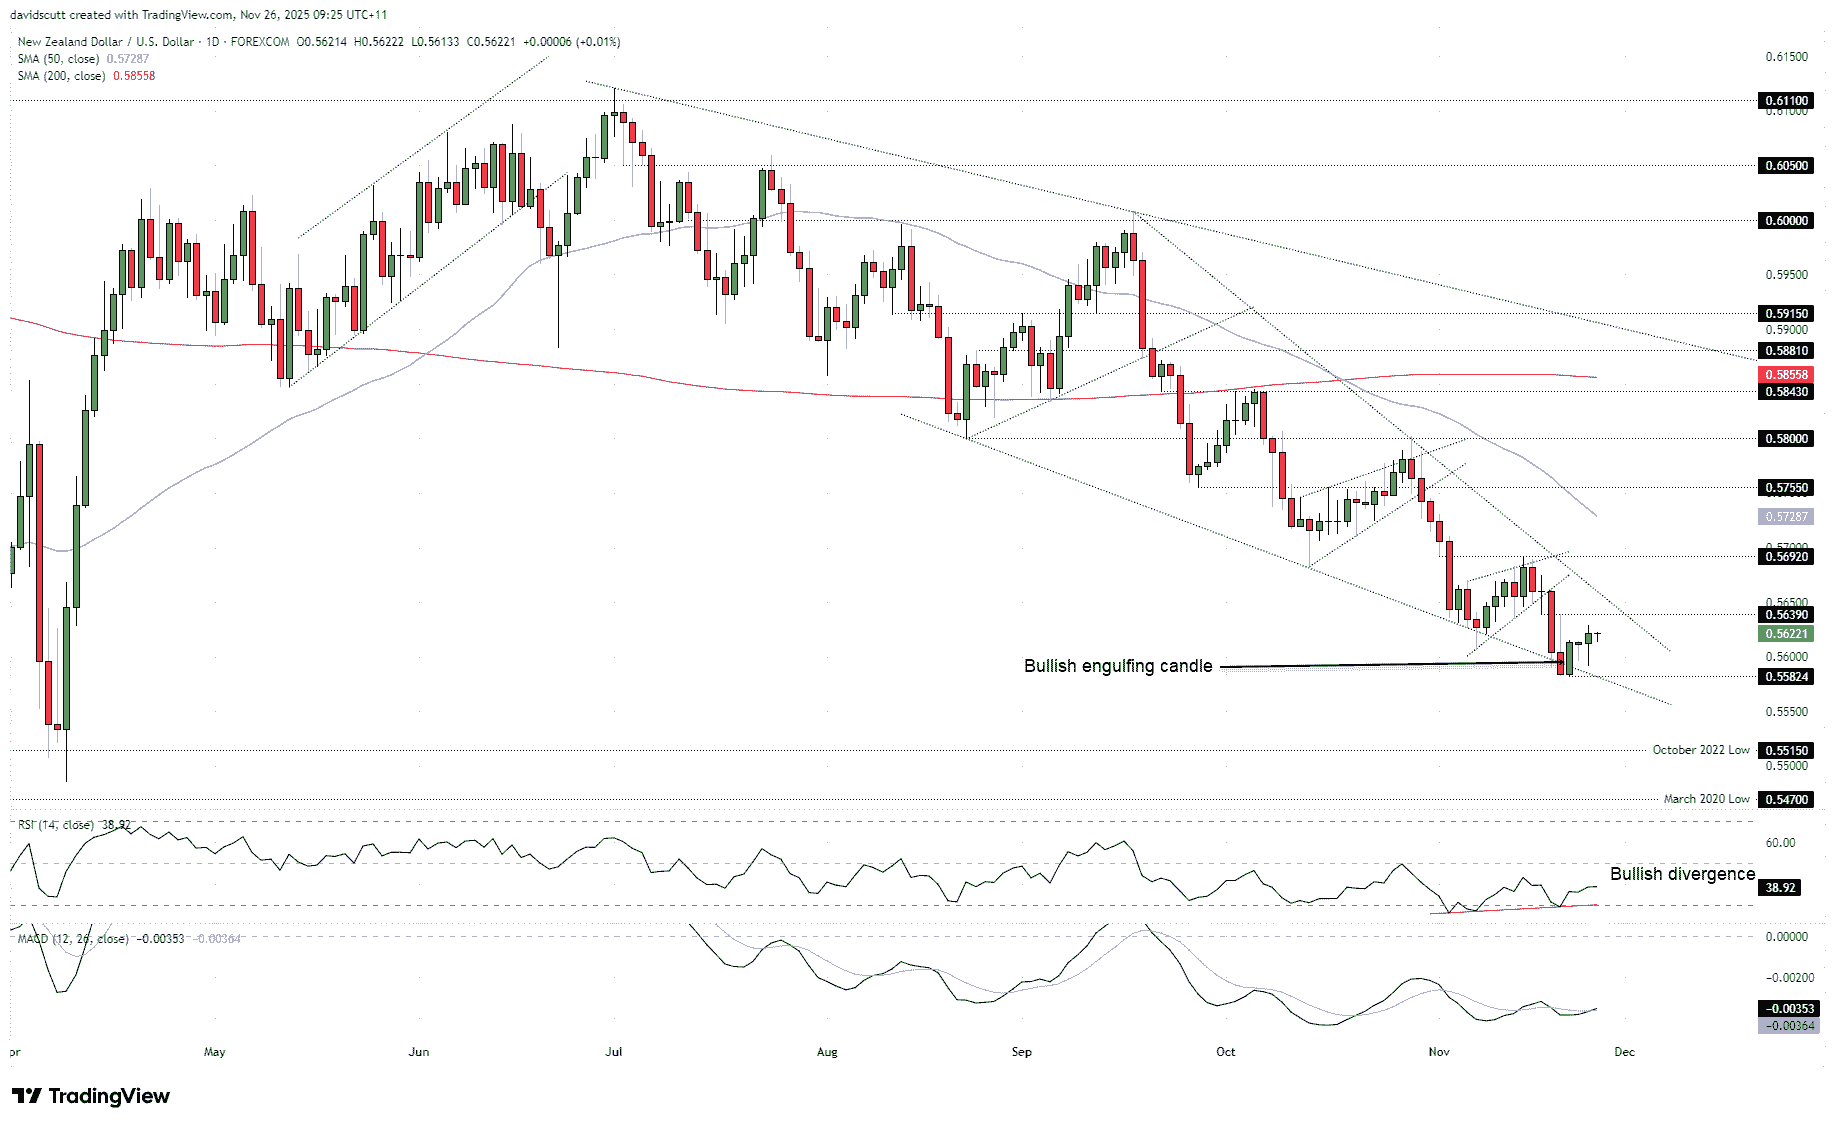
As shown in the daily chart below, NZD/USD has been in a sustained downtrend through the second half of the year, marked by a series of lower highs and lower lows. However, there are indications we may have seen a near-term bottom heading into today’s meeting. The first is the bullish engulfing candle that printed last Friday, with price reversing sharply after a false break of downtrend support a session earlier. Since then, price has been grinding higher toward minor resistance at 0.5939.
Source: TradingView
Momentum is also showing signs of turning. We’ve seen bullish divergence between price and RSI (14), with the latter trending higher, signaling waning downside strength. Combined with the MACD signal line crossover, the message is one of caution for bears, hinting they’re slowly losing their grip. Should current trends persist, it may flip the overall signal bullish from bearish for the first time in months.
Key downside levels include 0.5582, 0.5515, and 0.5470, with the first likely to be broken should the RBNZ go 50 today. On the upside, a break of 0.5639 would put price on a collision course with the September downtrend. Given the falling wedge pattern Kiwi has been trading in, a bullish breakout above that level implies we could see far higher levels, putting 0.5692, the 50DMA, and 0.5755 resistance potentially in play.
Source: TradingView
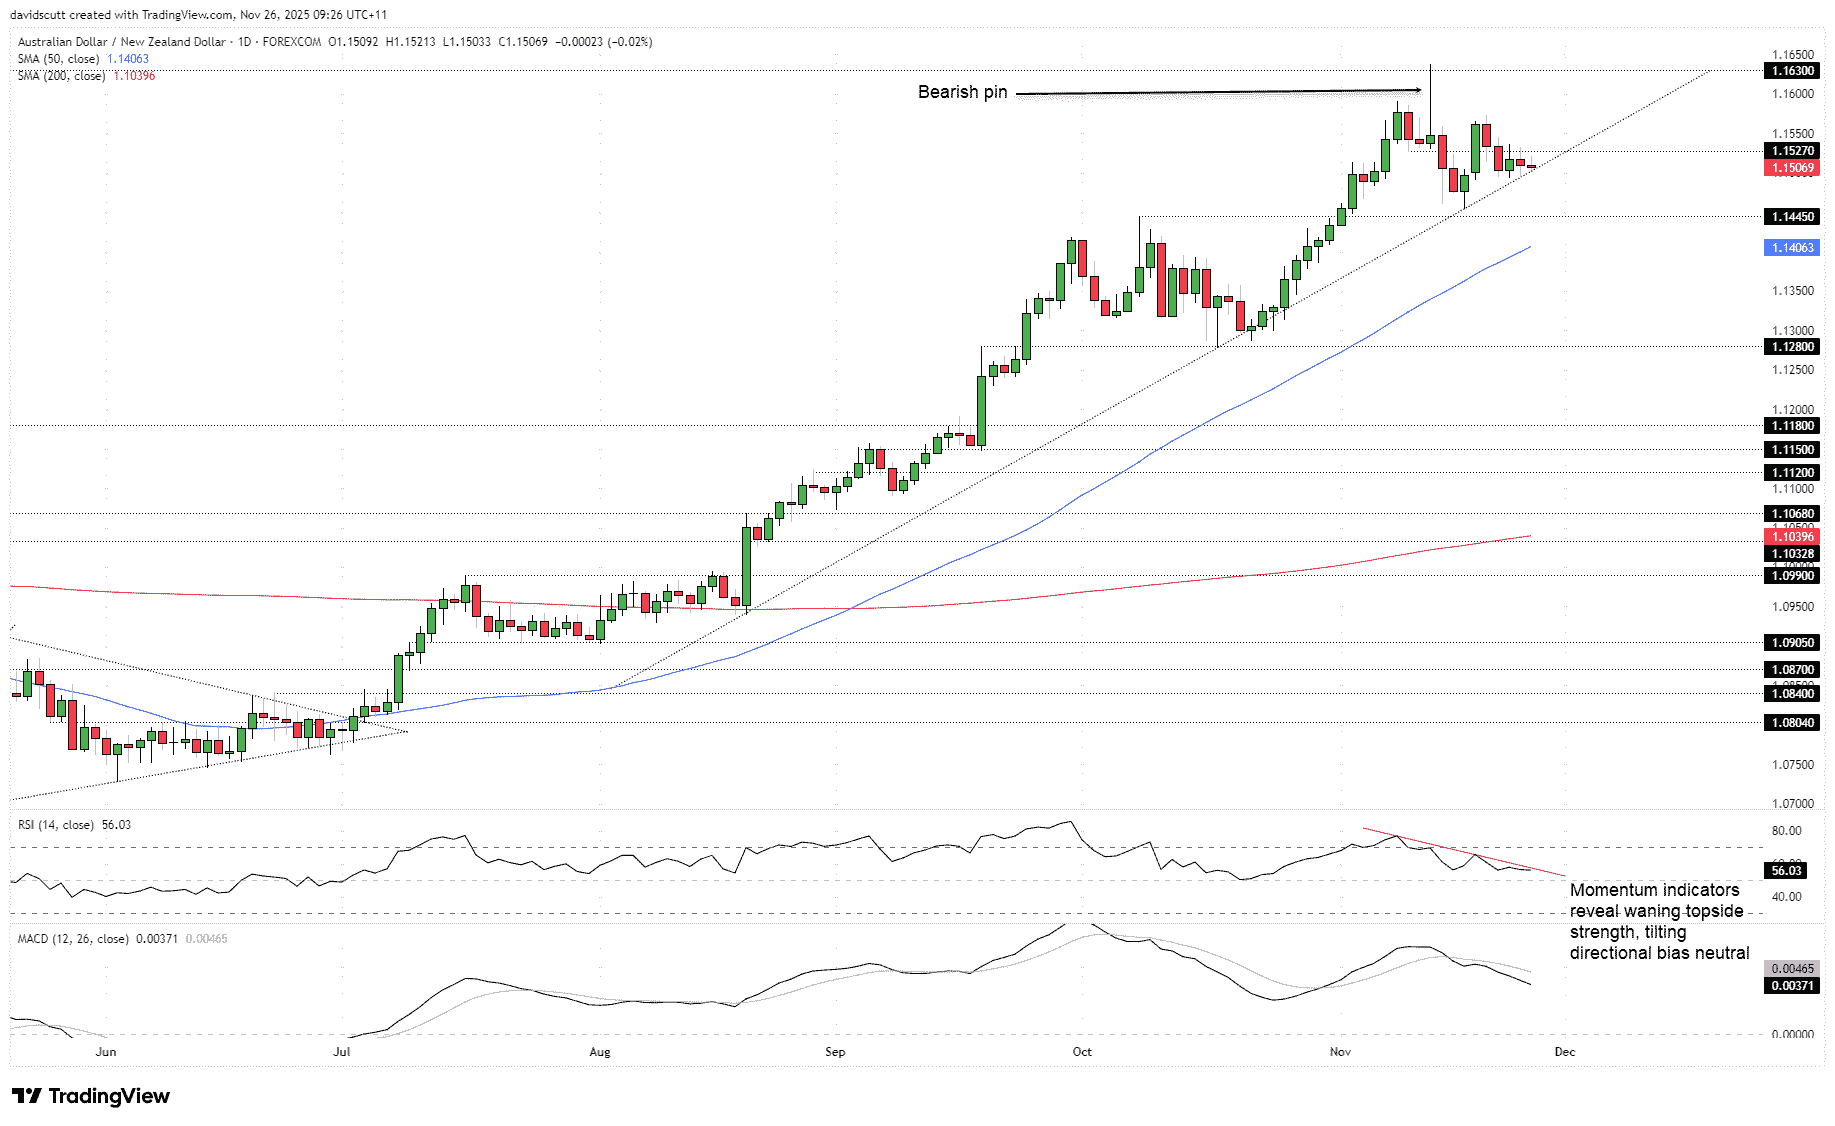
Turning to AUD/NZD, it too looks like it may have topped out, with price unable to return toward recent highs following a sharp reversal earlier this month, delivering what ended up being a bearish pin that warned of downside risks. Since then, price has been trading sideways, leaving it wedged today right against uptrend support dating back to August. If broken cleanly, it would put 1.1445, the 50DMA, and 1.1280 support on the radar for bears.
Should AUD/NZD hold the uptrend, 1.1527 is a minor level above before more pronounced resistance kicks in at 1.1630. Momentum indicators suggest diminishing upside strength, with RSI (14) trending lower toward the neutral 50 level. MACD confirms the cautious signal for bulls, having already crossed the signal line from above before trending lower while remaining in positive territory. The overall bias is now more neutral than bullish, placing increased emphasis on price action to drive direction.
Latest market news




The complete CFD trading experience
Award-winning platforms, competitive spreads, low commissions and dedicated support.
We live and breathe the markets and are dedicated to helping traders realise their ambitions as we continue to set the industry bar.
Economic calendar
Web Trader platform
Our sophisticated web-based platform is packed with features.
Related articles
Canadian Dollar Short-term Outlook: USD/CAD Five-Week Rally Hits a Wall at Major Resistance 10 14 2026
USD/CAD is holding near fresh yearly highs, but bearish divergence and a well-defined October range raise the stakes at major resistance.

EUR/USD Analysis: Euro Loses Ground After a Stronger-Than-Expected U.S. CPI Report
The trading week continues to unfold and weakness around the euro has once again become increasingly evident in the short term. This can be seen in the recent performance of EUR/USD, which has declined roughly 0.3% over the last three trading sessions, highlighting renewed strength in the U.S. dollar.

USD/JPY forecast: hot US CPI lifts the pair above its 200-day average
Hotter-than-expected US inflation has pushed USD/JPY above its 200-day moving average, putting 160 and the risk of Bank of Japan intervention back in focus. The breakout still needs to hold, and a failure could send the pair sharply lower.

StoneX Europe Ltd may make third party material available on this website which may contain information included but not limited to the conditions of financial markets. The material is for information purposes only and does not contain, and should not be construed as containing, investment advice and/or investment recommendation and/or an investment research and/or an offer of or solicitation for any transactions in financial instruments; any decision to enter into a specific transaction shall be made by the client following an assessment by him/her of their situation.
StoneX Europe Ltd makes no representation or warranty and assumes no liability as to the accuracy or completeness of the information provided, nor any loss arising from any investment based on a recommendation, forecast or other information supplied. You should always seek independent advice as to your suitability to speculate in any related markets and your ability to assume the associated risks, if you are at all unsure. We are not under any obligation to update any such material. Any opinion made may be personal to the author and may not reflect the opinion of StoneX Europe Ltd.