



Nasdaq 100 Outlook: Bullish momentum drives fresh all-time highs
With a 9-session bullish streak, the Nasdaq index has recorded one of the most relevant upward moves of recent years, pushing price to new all-time highs above the 26,000 level in the short term.
Share this:

With a 9-session bullish streak, the Nasdaq index has recorded one of the most relevant upward moves of recent years, pushing price to new all-time highs above the 26,000 level in the short term.
The strong buying pressure has remained consistent, driven by renewed market confidence and optimism surrounding potential negotiations in the Middle East. If this sentiment remains in place, buying pressure is likely to continue dominating Nasdaq price action in the coming sessions.


Confidence continues to rebound
Today’s session has been accompanied by new developments in the Middle East conflict. President Trump has publicly stated that, in addition to ongoing negotiations with Iran, a 10-day ceasefire between Israel and Lebanon has been reached.
Although this does not fully resolve the conflict, it reinforces the idea that more concrete negotiations are taking place, contributing to a more stable geopolitical environment in the short term. This has allowed risk perception to continue declining, supporting a more optimistic market backdrop.
This shift is already reflected in confidence indicators. The CNN Fear and Greed Index has entered the “greed” zone for the first time in months, reaching levels around 62 points, well above 37 points a week ago and near 20 points a month ago, when markets were in “extreme fear.”
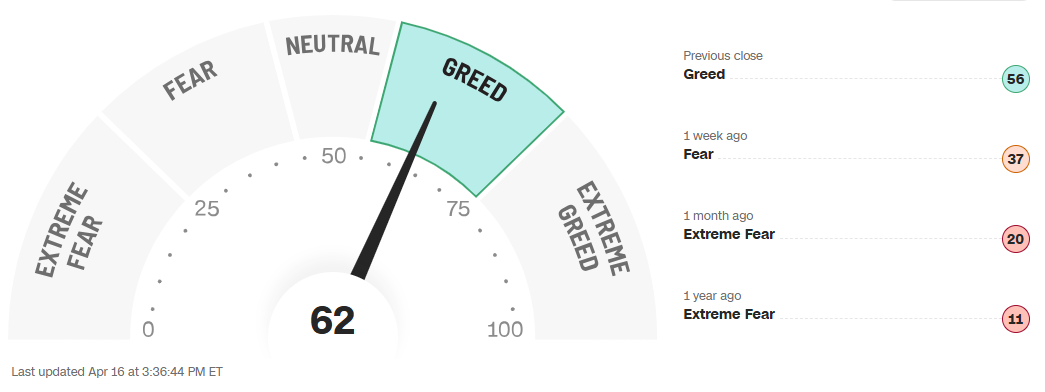
Source: CNN
This rebound in confidence has led to a renewed appetite for risk assets, moving away from the preference for safe-haven assets seen in previous weeks. This is also reflected in ETF flows, particularly the Invesco QQQ Trust, which has recorded net inflows close to $1 billion since the start of the week, maintaining a positive trend through April 15.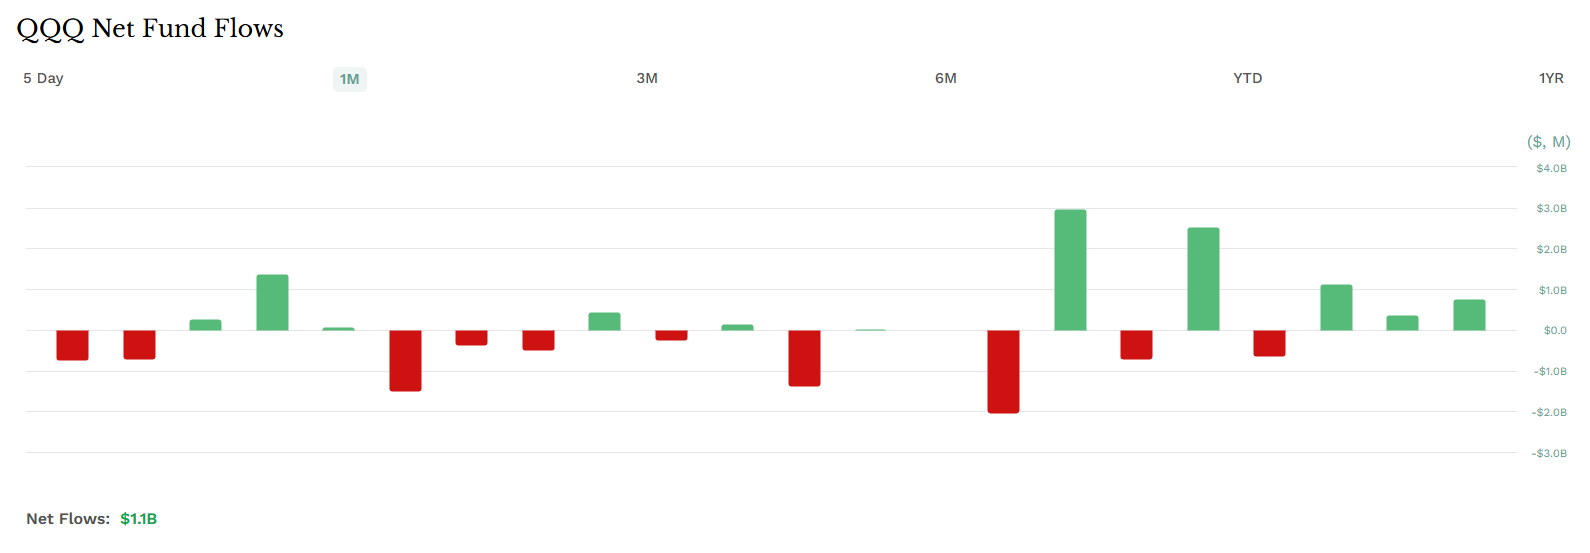
Source: ETF.COM
In this context, rising confidence is creating a favorable environment for Nasdaq demand in the short term. However, this scenario remains dependent on continued progress in Middle East negotiations. If an agreement is reached, buying pressure could remain strong, but a renewed escalation could quickly reverse this dynamic.
Long-term confidence remains fragile
Despite the improvement in the short term, the longer-term outlook remains fragile. According to the AAII Investor Sentiment Survey, optimism for the next six months stands at 31.7%, neutrality at 25.5%, and pessimism at 42.8%, indicating that sentiment remains tilted toward the downside.
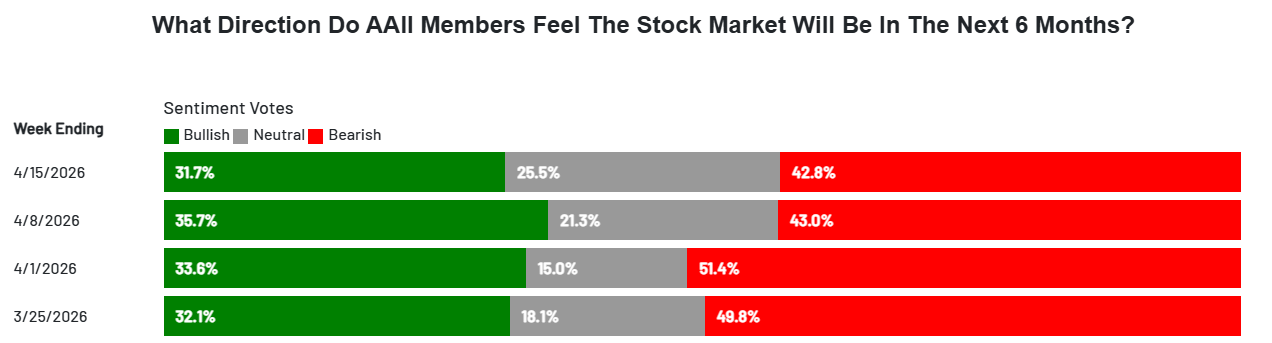
Source: AAII
This environment could limit a more structural recovery in equity markets, as lingering uncertainty may constrain sustained demand. If this bias persists, a phase of indecision could remain present in Nasdaq price action over the medium term.
Nasdaq 100 Technical Outlook
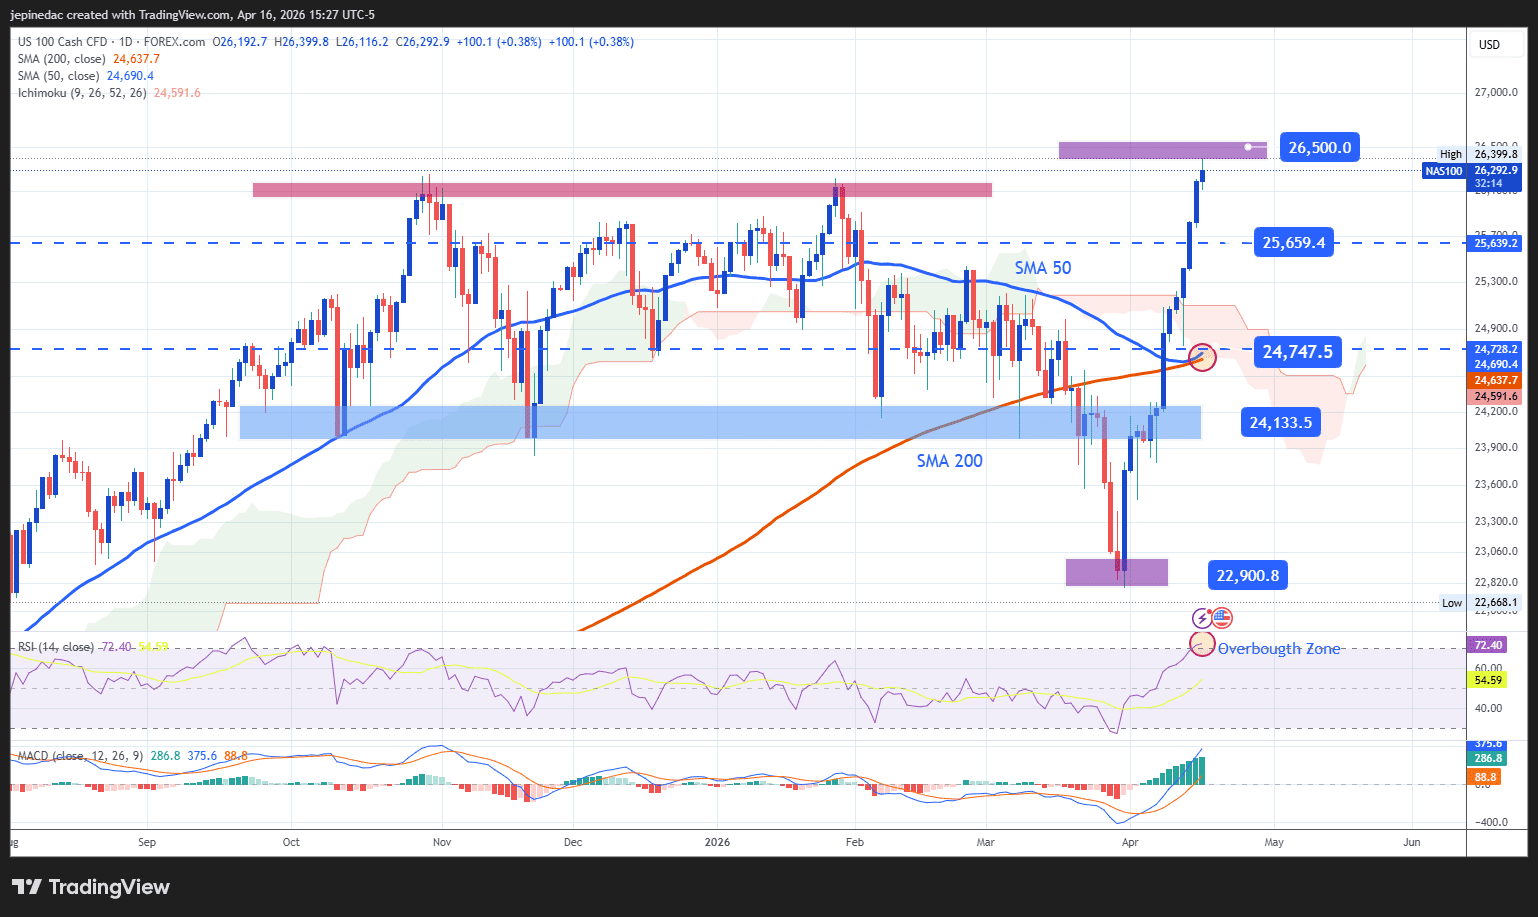
Source: StoneX, Tradingview
- Bullish momentum breaks key barriers: The recent recovery in the Nasdaq has been strong enough to break previous all-time high levels and establish new record prices. This move could support the development of a more structured bullish trend in the coming weeks. However, the speed of the rally may also be creating a short-term overextension scenario, which could open the door for potential corrections.
- MACD: The MACD histogram remains consistently above the zero line, suggesting that short-term moving average momentum continues to show a bullish bias. If this behavior persists, buying pressure is likely to remain relevant in the short term.
- RSI: The RSI presents a slightly different picture, as it has moved closer to the overbought zone (70). This suggests that buying momentum may be reaching elevated levels, potentially opening the door for short-term pullbacks in the coming sessions.
Key levels:
- 26,500 points – Key resistance: With no higher historical references, this level stands as the closest psychological barrier in the short term. Price action above this level could reinforce a more aggressive bullish bias in the coming sessions.
- 25,650 points – Near-term barrier: A recent retracement level that may act as a reference point for potential short-term corrections.
- 24,740 points – Key support: A relevant support zone aligned with the 50- and 200-period moving averages. A move toward this level could weaken the current bullish bias and lead to a more consistent phase of indecision in the coming weeks.
Written by Julian Pineda, CFA, CMT – Market Analyst
Follow him on: @julianpineda25
Latest market news




The complete CFD trading experience
Award-winning platforms, competitive spreads, low commissions and dedicated support.
We live and breathe the markets and are dedicated to helping traders realise their ambitions as we continue to set the industry bar.
Economic calendar
Web Trader platform
Our sophisticated web-based platform is packed with features.
Related articles

Stocks on Watch After CPI-Fueled Breakdown: SPX, Nasdaq, NVDA
Coming into the week there was an early case of divergence as AI and tech had started to show lag behind the S&P. That shift is growing more noticeable following a higher-than-expected CPI print.


Nasdaq 100 Forecast: NDX falls after hotter inflation data
U.S. stocks are falling after hotter-than-expected U.S. inflation data, which has lifted Fed rate hike expectations.


Dow Jones outlook: CPI, oil and yields put the rally to the test
US index futures rebounded in the first half of Wednesday’s session, along with European indices ahead of the release of US CPI. Some slightly dovish remarks from the Fed’s Williams seem to have helped sentiment a little, but whether those comments will be backed by data remains to be seen. While slightly hotter than expected inflation data shouldn’t be enough for markets to price in an October Fed hike with more than a coin flip probability, it can nonetheless reinforce expectations of further tightening later in the year.

StoneX Europe Ltd may make third party material available on this website which may contain information included but not limited to the conditions of financial markets. The material is for information purposes only and does not contain, and should not be construed as containing, investment advice and/or investment recommendation and/or an investment research and/or an offer of or solicitation for any transactions in financial instruments; any decision to enter into a specific transaction shall be made by the client following an assessment by him/her of their situation.
StoneX Europe Ltd makes no representation or warranty and assumes no liability as to the accuracy or completeness of the information provided, nor any loss arising from any investment based on a recommendation, forecast or other information supplied. You should always seek independent advice as to your suitability to speculate in any related markets and your ability to assume the associated risks, if you are at all unsure. We are not under any obligation to update any such material. Any opinion made may be personal to the author and may not reflect the opinion of StoneX Europe Ltd.