



Nasdaq 100 Outlook: Is the recovery returning to the equity market?
Recent sessions have been relatively positive for Nasdaq price action, with the index currently trading slightly above the 24,000 level and posting gains of more than 5% over the past few sessions.
Share this:

Recent sessions have been relatively positive for Nasdaq price action, with the index currently trading slightly above the 24,000 level and posting gains of more than 5% over the past few sessions. It seems that the recent buying pressure building in the short term has been driven by a modest recovery in confidence, as no further escalation has been seen in the Middle East conflict.
This has also allowed for some relief in safe-haven assets, such as U.S. Treasury yields, which in turn has supported a stabilization in demand for risk assets like the Nasdaq. If this dynamic continues, buying pressure could regain relevance in the coming sessions.


Bond yields begin to ease
Despite comments made today by President Trump suggesting that Iran could be defeated quickly, the lack of concrete actions has prevented a renewed surge in market risk sentiment in the short term. For now, markets appear to be reacting more to actual developments than to rhetoric, allowing for a modest recovery in risk appetite.
As a result, there has been no continuation in the upward trend of U.S. 10-year Treasury yields, which had been rising in previous sessions. Although inflation expectations remain elevated, recent oil price movements have not been strong enough to reinforce expectations of more aggressive monetary policy.
In fact, the 10-year yield has shown a pullback toward the 4.3% area, remaining relatively stable in recent sessions. This dynamic could persist as long as there are no new major catalysts, either from central banks or developments in the Middle East.
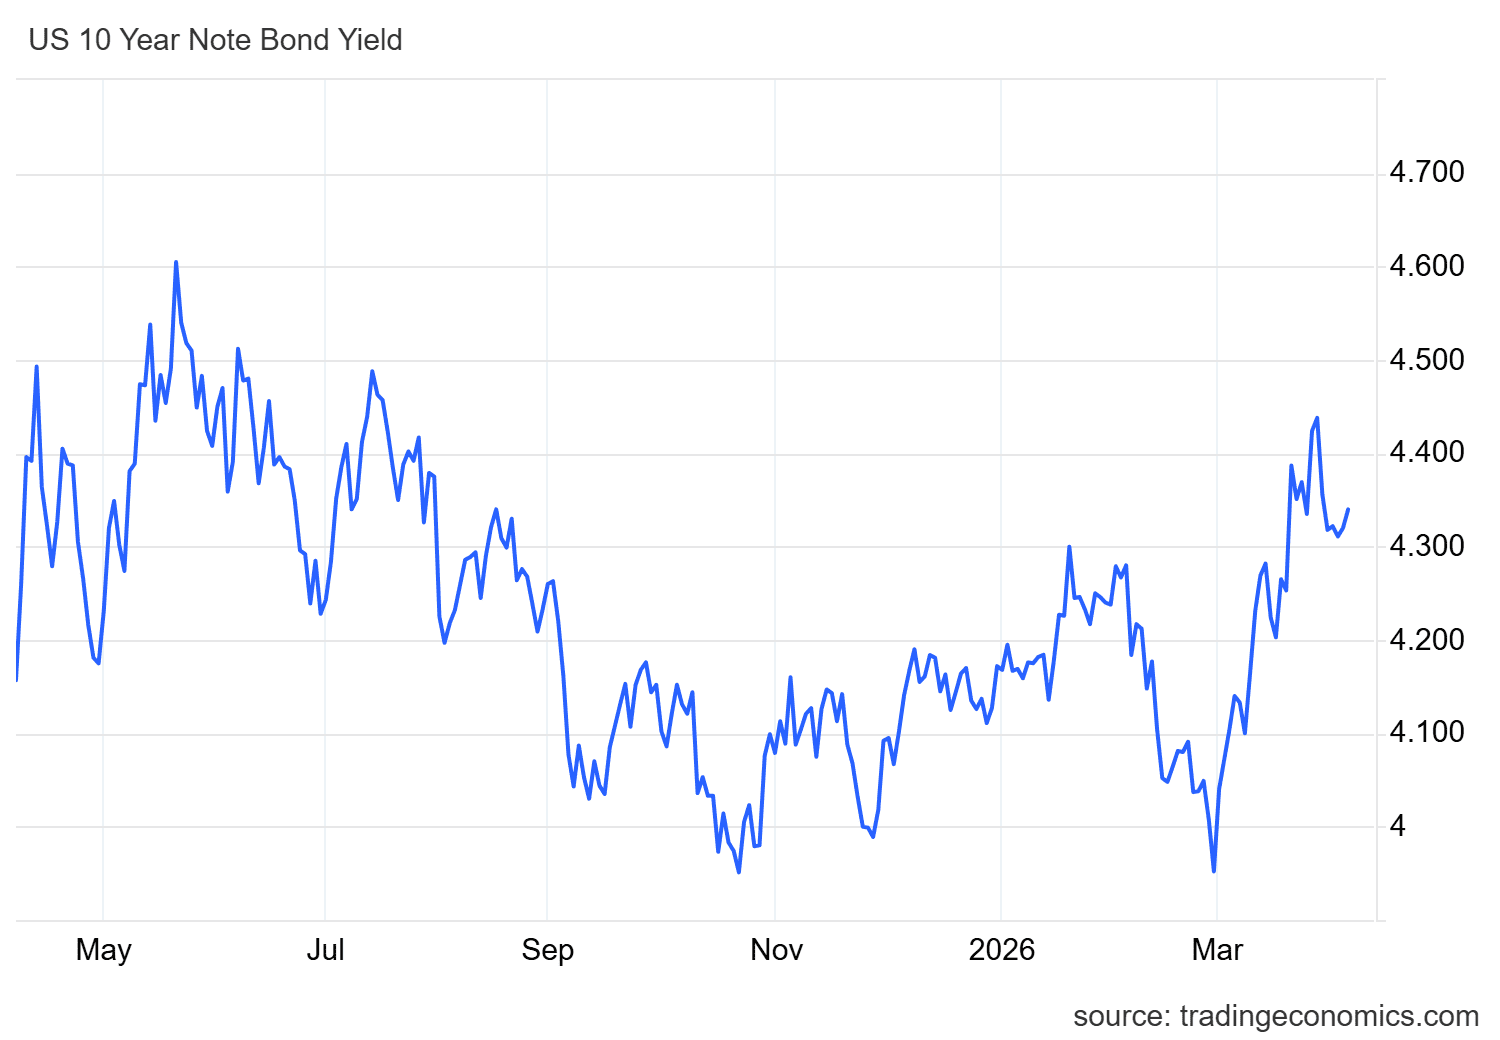
Source: TradingEconomics
This environment reflects two key effects: on one hand, reduced demand for safe-haven assets, and on the other, a potential rotation of capital toward risk markets, particularly equities. This has allowed demand for the Nasdaq to remain relatively firm in the short term.
This can be seen in the performance of its main components, with Nvidia (-0.06%), Apple (1.06%), Microsoft (-0.27%), Amazon (1.19%), and Google (1.51%). Although not all components are in positive territory, most are holding gains, suggesting that the equity market still maintains a degree of strength in the near term.
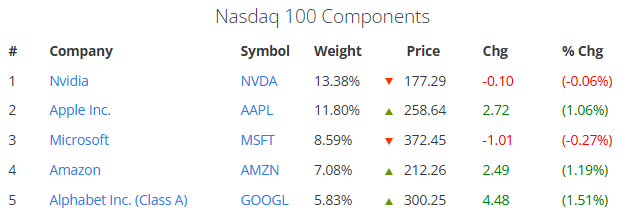
Source: Slickcharts
In this context, the market appears to be reacting more to the absence of extreme events than to ongoing headlines, maintaining a controlled cautious stance. This has reduced the relative appeal of the bond market and allowed the Nasdaq to recover ground, a dynamic that could continue if current conditions persist.
However, it is important to note that the index remains highly sensitive to changes in risk perception. A more significant escalation in the conflict could quickly reverse the recent recovery and bring weakness back into the equity market.
Long-term confidence remains fragile
Despite recent short-term stability, the long-term outlook remains fragile. According to the AAII Investor Sentiment Survey, optimism for the next six months stands at 33.6%, neutrality at 15.0%, and pessimism at 51.4%, indicating that market sentiment remains clearly tilted toward the downside.
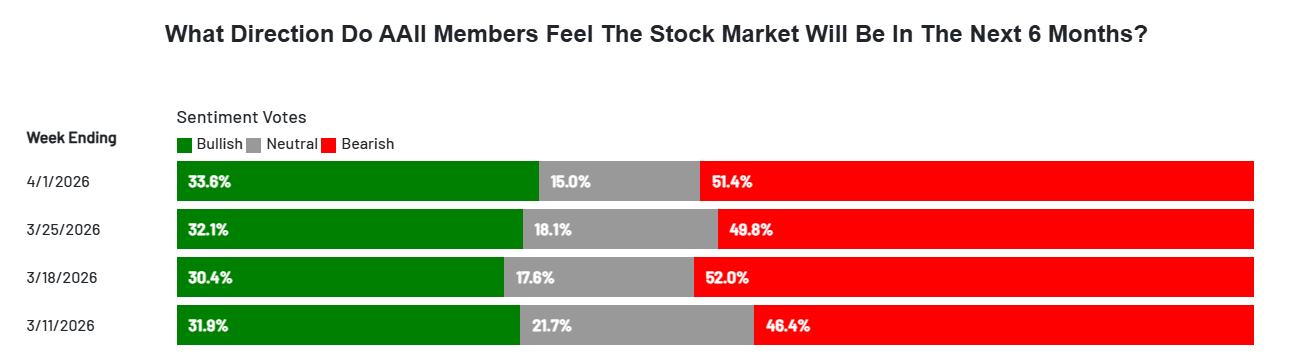
Source: AAII
This scenario could limit a structural recovery in equities, including indices like the Nasdaq, as overall uncertainty restricts the entry of sustained demand. As long as this pessimistic bias persists, weakness could remain a relevant factor in the index’s medium-term performance.
Nasdaq 100 Technical Outlook
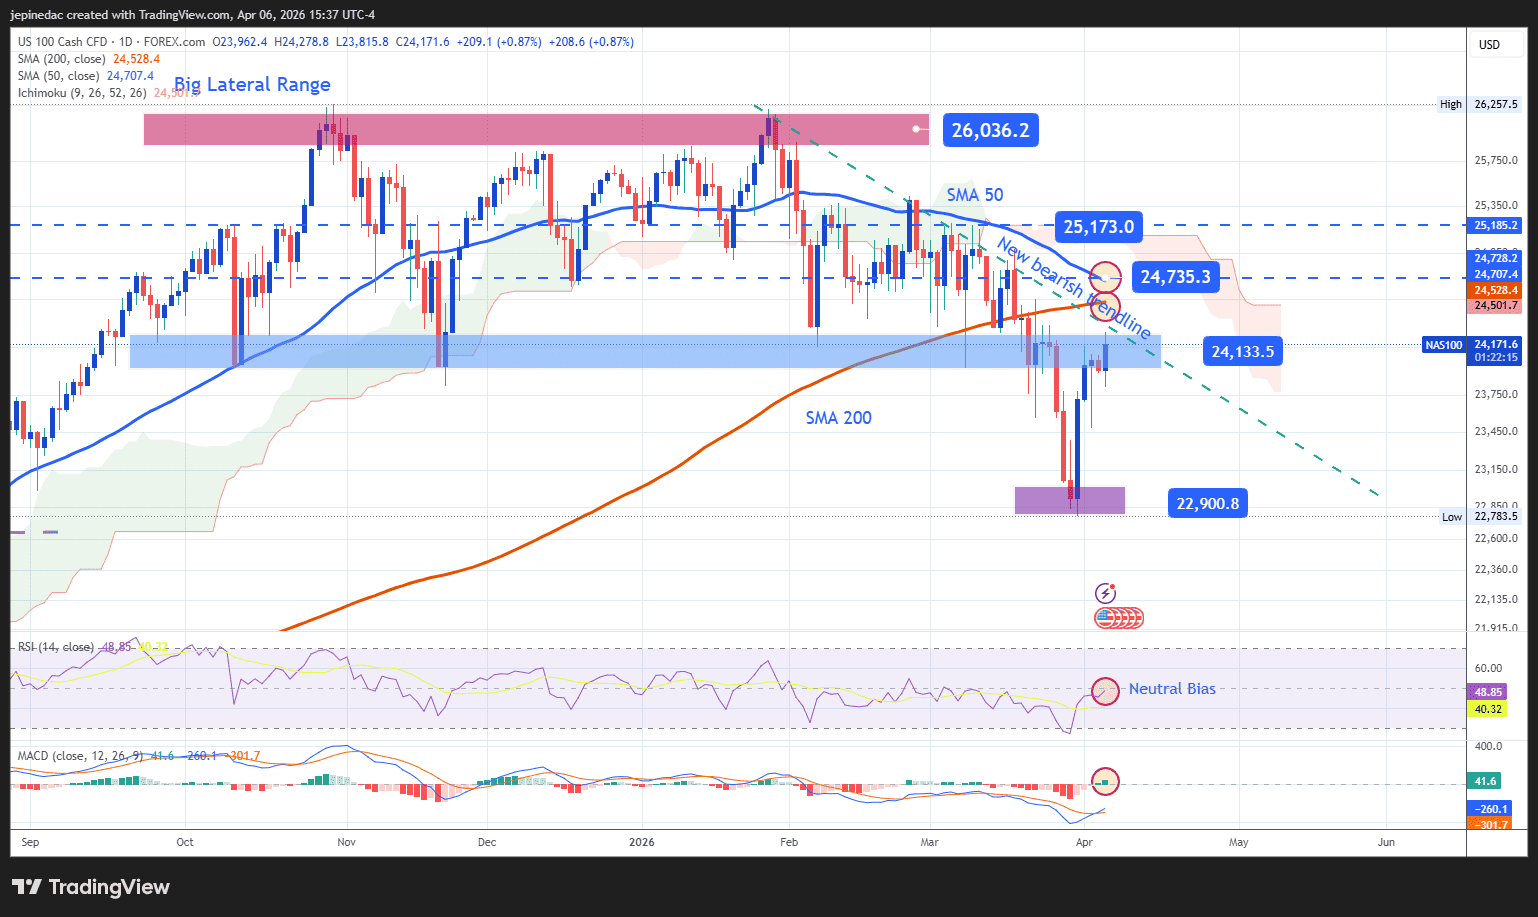
Source: StoneX, Tradingview
- Downtrend remains intact: Despite the recent recovery in the Nasdaq, the chart continues to show a long-term downward trendline that remains the most important technical reference. So far, the rebound has not been strong enough to invalidate this structure, meaning that if selling pressure returns, it could support a further extension of the downtrend in the coming sessions.
- RSI: Despite the recent rebound, the indicator remains close to the 50 neutral level, suggesting a balance between buying and selling momentum. Unless this level is clearly broken, neutral conditions may continue to dominate in the short term.
- MACD: The histogram remains slightly above the zero line, indicating some bullish momentum, although still not strong enough to define a clear trend, reinforcing the possibility of a short-term indecision scenario.
Key levels:
- 24,735 points – Key resistance: This level aligns with a potential break of the downtrend line and key moving averages. A sustained move above this level could lead to a more dominant bullish bias.
- 24,133 points – Near-term barrier: A recent neutral zone. Price action around this level could continue to support a range-bound or indecisive scenario in the short term.
- 22,900 points – Key support: A recent low. A move toward this level could reactivate a stronger bearish bias and extend the downtrend in the medium term.
Written by Julian Pineda, CFA, CMT – Market Analyst
Follow him on: @julianpineda25
Latest market news




The complete CFD trading experience
Award-winning platforms, competitive spreads, low commissions and dedicated support.
We live and breathe the markets and are dedicated to helping traders realise their ambitions as we continue to set the industry bar.
Economic calendar
Web Trader platform
Our sophisticated web-based platform is packed with features.
Related articles

Stocks on Watch After CPI-Fueled Breakdown: SPX, Nasdaq, NVDA
Coming into the week there was an early case of divergence as AI and tech had started to show lag behind the S&P. That shift is growing more noticeable following a higher-than-expected CPI print.


Nasdaq 100 Forecast: NDX falls after hotter inflation data
U.S. stocks are falling after hotter-than-expected U.S. inflation data, which has lifted Fed rate hike expectations.


Dow Jones outlook: CPI, oil and yields put the rally to the test
US index futures rebounded in the first half of Wednesday’s session, along with European indices ahead of the release of US CPI. Some slightly dovish remarks from the Fed’s Williams seem to have helped sentiment a little, but whether those comments will be backed by data remains to be seen. While slightly hotter than expected inflation data shouldn’t be enough for markets to price in an October Fed hike with more than a coin flip probability, it can nonetheless reinforce expectations of further tightening later in the year.

StoneX Europe Ltd may make third party material available on this website which may contain information included but not limited to the conditions of financial markets. The material is for information purposes only and does not contain, and should not be construed as containing, investment advice and/or investment recommendation and/or an investment research and/or an offer of or solicitation for any transactions in financial instruments; any decision to enter into a specific transaction shall be made by the client following an assessment by him/her of their situation.
StoneX Europe Ltd makes no representation or warranty and assumes no liability as to the accuracy or completeness of the information provided, nor any loss arising from any investment based on a recommendation, forecast or other information supplied. You should always seek independent advice as to your suitability to speculate in any related markets and your ability to assume the associated risks, if you are at all unsure. We are not under any obligation to update any such material. Any opinion made may be personal to the author and may not reflect the opinion of StoneX Europe Ltd.