



Nasdaq Analysis: The index starts the week with a bullish bias, approaching the 25,000 level
The trading week has started with a positive bias in Nasdaq price movements in the short term. The equity index recorded a gain of more than 1.4% at the start of the week, amid a slight recovery in market confidence.
Share this:

The trading week has started with a positive bias in Nasdaq price movements in the short term. The equity index recorded a gain of more than 1.4% at the start of the week, amid a slight recovery in market confidence. This occurs in a context where efforts are being made to coordinate a partial reopening of the Strait of Hormuz, while investors also remain attentive to expectations surrounding the U.S. Federal Reserve’s policy decision later this week.
For now, these developments have allowed short-term confidence in the equity markets to show a moderate recovery, which could continue during the coming trading sessions and partially support Nasdaq price movements in the short term.


A temporary sense of calm
Although risk sentiment in financial markets remains a relevant factor due to the ongoing geopolitical conflict in the Middle East, recent updates have allowed market sentiment to show a temporary sense of calm.
The main concern was an extreme scenario in which the Strait of Hormuz could become completely unavailable for shipping in the coming weeks. However, over the weekend it was reported that Iran stated the strait would be closed only to enemy countries, while other non-involved parties could continue navigating through the area. In addition, it was reported that the United States is attempting to organize a naval coalition to secure maritime traffic in the region.
This scenario has led the market to consider that part of the global trade flows could resume sooner than previously expected, something that has already been reflected in the behavior of WTI crude oil, which began the week moving away from the $100 reference level.
Since a major military escalation has not taken place and the worst-case scenario in the Strait of Hormuz has not materialized, confidence in risk markets has begun to recover slightly. At the moment, a positive risk appetite can be observed, particularly in the equity market and among the main components of the Nasdaq 100.
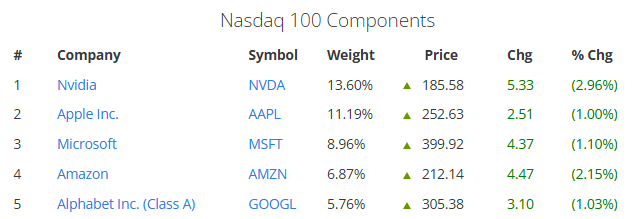
Recent movements show the top five components of the index posting gains: Nvidia rises more than 2.96%, Apple climbs around 1.00%, Microsoft advances 1.10%, Amazon gains about 2.15%, and Alphabet increases roughly 1.03%. This suggests that the positive market bias is reflected in the main components of the index, indicating that confidence has managed to stabilize slightly in the equity market in the short term.
Source: Slickcharts
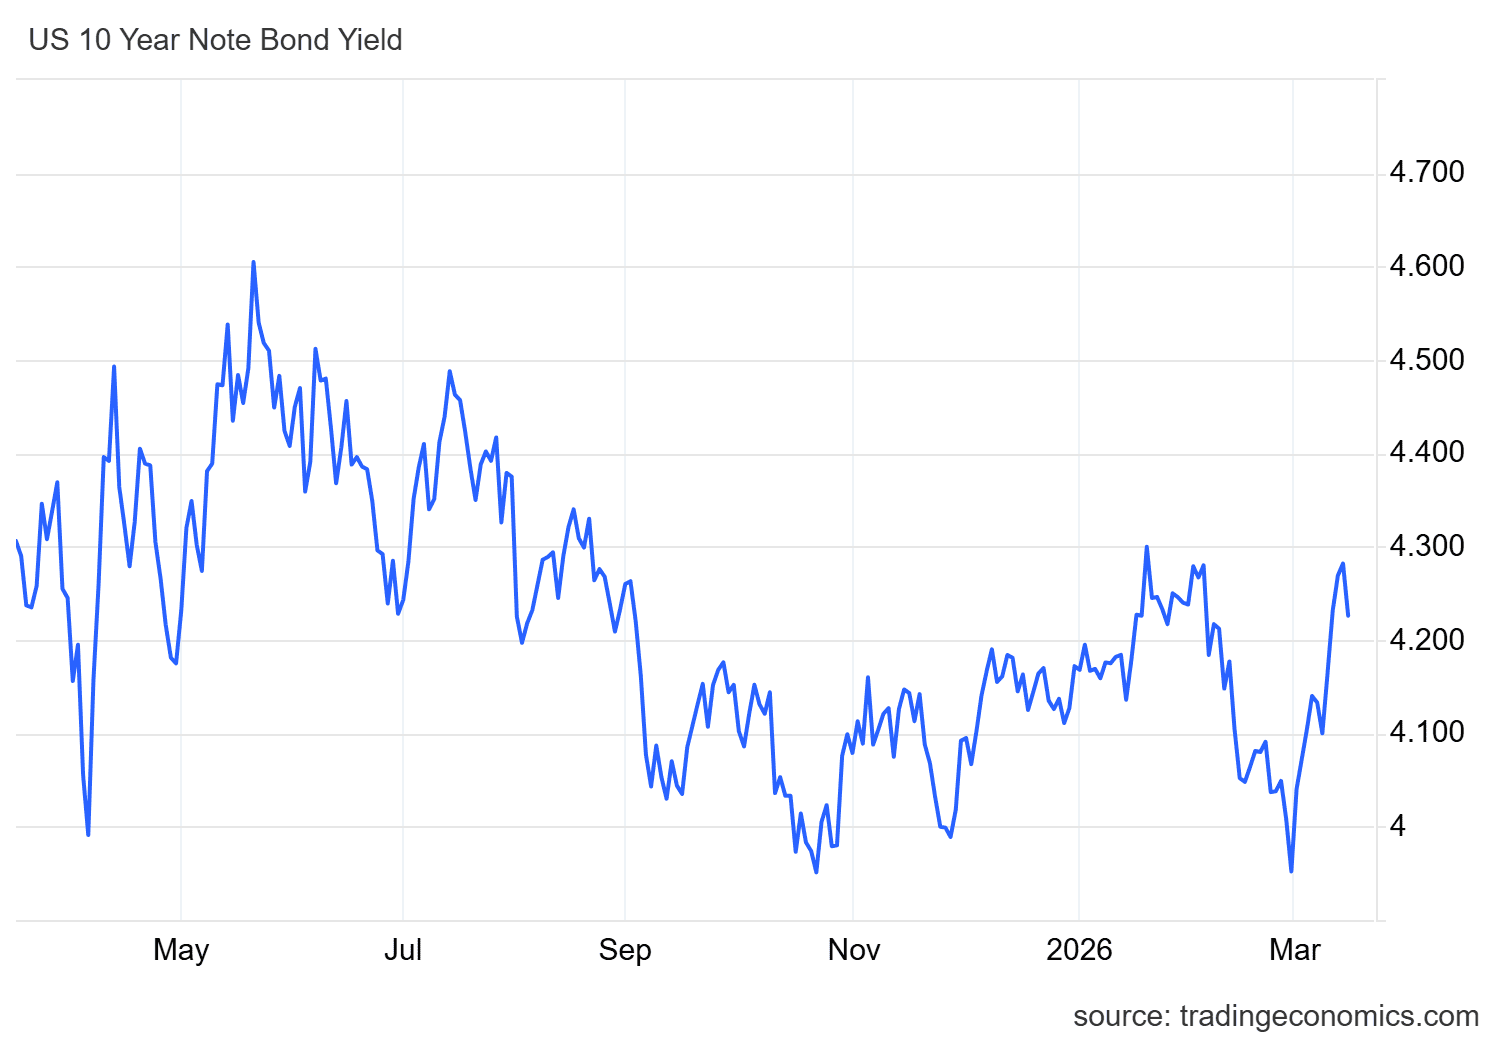
In the same context, it is also important to note that alternative safe-haven assets, such as U.S. 10-year Treasury bonds, have begun to lose attractiveness. The yield has declined from levels close to 4.3% and now trades around 4.2%, reflecting some weakness in the bond market.
The reduction in the attractiveness of these safe-haven assets, combined with the temporary sense of calm, may be allowing interest in risk assets such as the Nasdaq to stabilize more consistently in the short term.
Source: TradingEconomics
In this scenario, if the sense of calm persists and the attractiveness of alternative markets such as bonds continues to decline, this could help demand for equity indices such as the Nasdaq 100 recover in the short term, potentially generating more stable buying pressure in the coming trading sessions.
However, it is important to note that the index has previously shown significant sensitivity to escalations in the conflict, meaning current confidence could deteriorate quickly if new developments increase market risk again.
The market awaits the central bank
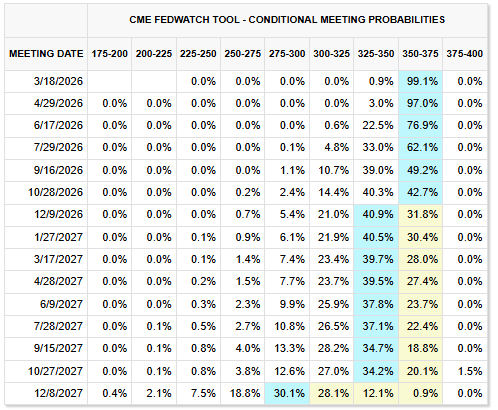
Despite the recent rebound in confidence seen in the Nasdaq index, the Federal Reserve’s policy decision on Wednesday still remains a key event this week. At the moment, the probability outlook shows more than 90% chance that the next two policy decisions will result in no changes to interest rates.
In fact, a potential rate cut is not expected until December 2026, where current probabilities indicate around a 40.9% chance that the policy rate could fall below the current 3.75% level.
Source: CMEGROUP
In this context, markets may remain focused on what could happen with monetary policy in the coming months. If the current scenario of neutral interest rates for an extended period continues, it could eventually affect the performance of the equity market in the coming weeks.
An environment where rate cuts are not anticipated keeps financing costs elevated, which could begin to weigh on the earnings outlook of major companies heading into 2026. For this reason, if this week confirms a neutral rate outlook for a large part of 2026, the recent recovery in Nasdaq confidence could weaken again, potentially leading to renewed episodes of price weakness in the coming sessions.
Nasdaq 100 Technical Outlook
Source: StoneX, Tradingview
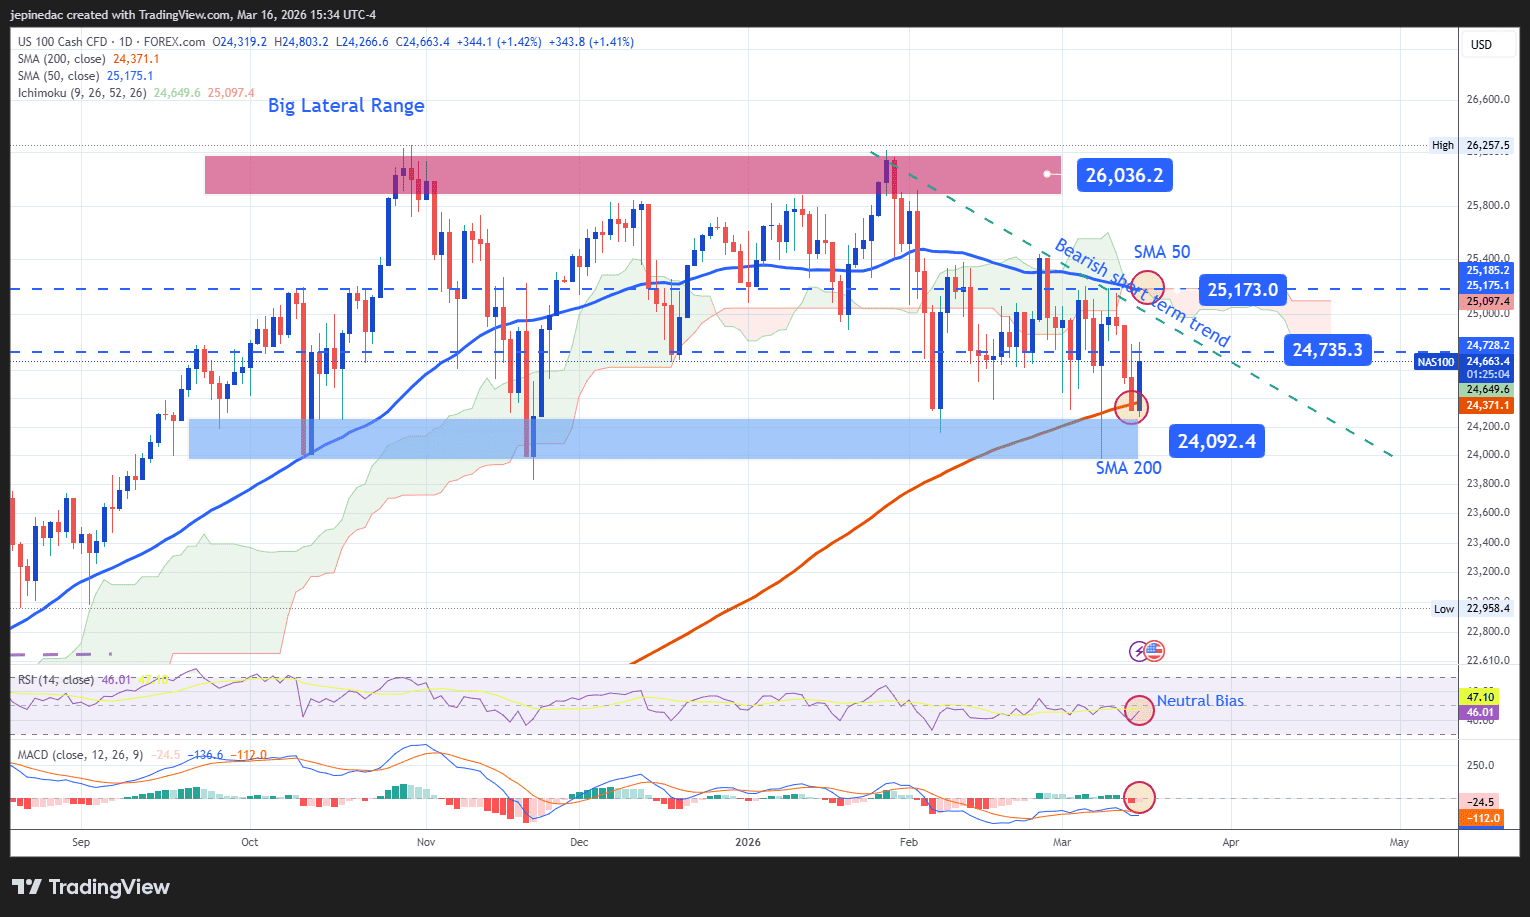
- The recovery is still not enough: Although the index has attempted to consolidate a meaningful rebound at the start of the week, average price movements remain within a broad long-term sideways range, which also coincides with the possible formation of a short-term downward trendline. If the price recovery fails to remain consistent in the coming sessions, the market could move into a phase of indecision or renewed weakness. This suggests that, for now, further development of bullish momentum is still needed before a more structured bullish pattern can be identified on the Nasdaq daily chart.
- RSI: The RSI indicator continues to oscillate around the neutral 50 level, suggesting that buying and selling momentum remains relatively balanced. As long as the indicator continues to move around this level, a neutral market sentiment could remain present in the coming sessions.
- MACD: A similar scenario can be observed in the MACD indicator, whose histogram continues to oscillate close to the zero line, suggesting that no dominant force currently exists in the short-term moving average dynamics. This could reinforce the idea of a neutral phase in recent price movements.
Key levels:
- 25,173 points – Key resistance: Level located near the barrier formed by the potential downward trendline and the 50-period simple moving average. Price movements above this level could invalidate the current bearish structure and open the door for a dominant bullish bias in the coming sessions.
- 24,735 points – Near-term barrier: A relevant neutrality zone observed during recent weeks. If price movements fail to move decisively away from this level, the market could enter a phase of indecision, extending the broad sideways range seen in the index in recent months.
- 24,092 points – Key support: Level corresponding to the lower boundary of the sideways range, which also aligns with the 200-period simple moving average. Price movements below this level could activate a relevant bearish bias, reinforcing the potential downward trendline in the coming weeks.
Written by Julian Pineda, CFA, CMT – Market Analyst
Follow him on: @julianpineda25
Latest market news




The complete CFD trading experience
Award-winning platforms, competitive spreads, low commissions and dedicated support.
We live and breathe the markets and are dedicated to helping traders realise their ambitions as we continue to set the industry bar.
Economic calendar
Web Trader platform
Our sophisticated web-based platform is packed with features.
Related articles

Stocks on Watch After CPI-Fueled Breakdown: SPX, Nasdaq, NVDA
Coming into the week there was an early case of divergence as AI and tech had started to show lag behind the S&P. That shift is growing more noticeable following a higher-than-expected CPI print.


Nasdaq 100 Forecast: NDX falls after hotter inflation data
U.S. stocks are falling after hotter-than-expected U.S. inflation data, which has lifted Fed rate hike expectations.


Dow Jones outlook: CPI, oil and yields put the rally to the test
US index futures rebounded in the first half of Wednesday’s session, along with European indices ahead of the release of US CPI. Some slightly dovish remarks from the Fed’s Williams seem to have helped sentiment a little, but whether those comments will be backed by data remains to be seen. While slightly hotter than expected inflation data shouldn’t be enough for markets to price in an October Fed hike with more than a coin flip probability, it can nonetheless reinforce expectations of further tightening later in the year.

StoneX Europe Ltd may make third party material available on this website which may contain information included but not limited to the conditions of financial markets. The material is for information purposes only and does not contain, and should not be construed as containing, investment advice and/or investment recommendation and/or an investment research and/or an offer of or solicitation for any transactions in financial instruments; any decision to enter into a specific transaction shall be made by the client following an assessment by him/her of their situation.
StoneX Europe Ltd makes no representation or warranty and assumes no liability as to the accuracy or completeness of the information provided, nor any loss arising from any investment based on a recommendation, forecast or other information supplied. You should always seek independent advice as to your suitability to speculate in any related markets and your ability to assume the associated risks, if you are at all unsure. We are not under any obligation to update any such material. Any opinion made may be personal to the author and may not reflect the opinion of StoneX Europe Ltd.