



Nonfarm Productivity and Unit Labor Costs surprise markets!
The Fed can at least take solace in the fact that wages are increasing with inflation
Share this:

Usually regulated to second tier data, the final look at Nonfarm Productivity and Until Labor Costs for Q3 came in worse than markets had expected. Nonfarm Productivity was -5.2% vs the -4.9% preliminary print. Note that this was the largest drop in quarterly productivity since Q2, 1960! Unit Labor Costs in the US for Q3 were up 9.6% vs and initial estimate of 8.3%. This print includes a 3.9% in hourly compensation. The rise in Unit Labor Costs is consistent with the increase in overall inflation data over the last few months. However, the Fed can at least take solace in the fact that wages are increasing with inflation.
On Friday the US will release CPI data for November. The headline print is expected to be 6.8% YoY vs 6.2% YoY in October. Core CPI is expected to be 4.9% YoY vs 4.6% YoY in October. Markets are paying particularly close attention to the inflation data this week, as the FOMC meets next week and is considering increasing the pace of tapering because of higher inflation.
The US Dollar Index (DXY) moved higher on the release of the surprise data, from roughly 96.20 to 96.40. The index has been rising in an orderly channel formation since late May when the DXY broke higher out of a descending wedge near 89.53. On November 19th, the index broke above the top trendline of the channel near 96.10 before pulling back into the channel on November 26th. Price has been hovering between 95.70 and 96.50 since then. Resistance is at the highs on November 23rd of 96.94 and then the 61.8% Fibonacci retracement from the March 2020 highs to the January 2021 lows near 97.73. Horizontal resistance and a double bottom target are near 98.17. However, price may also be flagging for lower. If that is the case and price does break lower, support is at the bottom of the flag pattern near 95.95. The target is near a long-term upward sloping trendline dating to 2011 near 95.09. Below there is the bottom trendline of the channel and horizontal support near 94.65.

Source: Tradingview, Stone X
Trade EUR/USD now: Login or open a new account!
EUR/USD has performed similar to, but opposite, the DXY. On the surprise data release, EUR/USD sold off from roughly 1.1250 down to 1.227. The pair had been falling in an orderly downward sloping channel since June 1st, when the pair broke lower out of an ascending wedge near 1.2250. The index broke below the bottom trendline of the channel near 1.1205 before pulling back into the channel on November 25th. Price has been hovering near 1. 1290 since then. EUR/USD is again testing the bottom trendline near 1.1250. If price breaks below, the November 24th low at 1.1186 is the next level of support ahead of horizontal support at 1.1144. Additional horizontal support isn’t until 1.1019! If the trendline holds, horizontal resistance is above at 1.1374, ahead of long-term horizontal resistance at 1.1490.

Source: Tradingview, Stone X
With the higher than expected inflation data today and US CPI on Friday, the DXY many be ready to continue higher and the EUR/USD may continue lower. However, don’t rule out a bout of profit taking ahead of Friday’s data and next week’s FOMC as the Fed decides whether to increase tapering!
Learn more about forex trading opportunities.
Usually regulated to second tier data, the final look at Nonfarm Productivity and Until Labor Costs for Q3 came in worse than markets had expected. Nonfarm Productivity was -5.2% vs the -4.9% preliminary print. Note that this was the largest drop in quarterly productivity since Q2, 1960! Unit Labor Costs in the US for Q3 were up 9.6% vs and initial estimate of 8.3%. This print includes a 3.9% in hourly compensation. The rise in Unit Labor Costs is consistent with the increase in overall inflation data over the last few months. However, the Fed can at least take solace in the fact that wages are increasing with inflation.
On Friday the US will release CPI data for November. The headline print is expected to be 6.8% YoY vs 6.2% YoY in October. Core CPI is expected to be 4.9% YoY vs 4.6% YoY in October. Markets are paying particularly close attention to the inflation data this week, as the FOMC meets next week and is considering increasing the pace of tapering because of higher inflation.
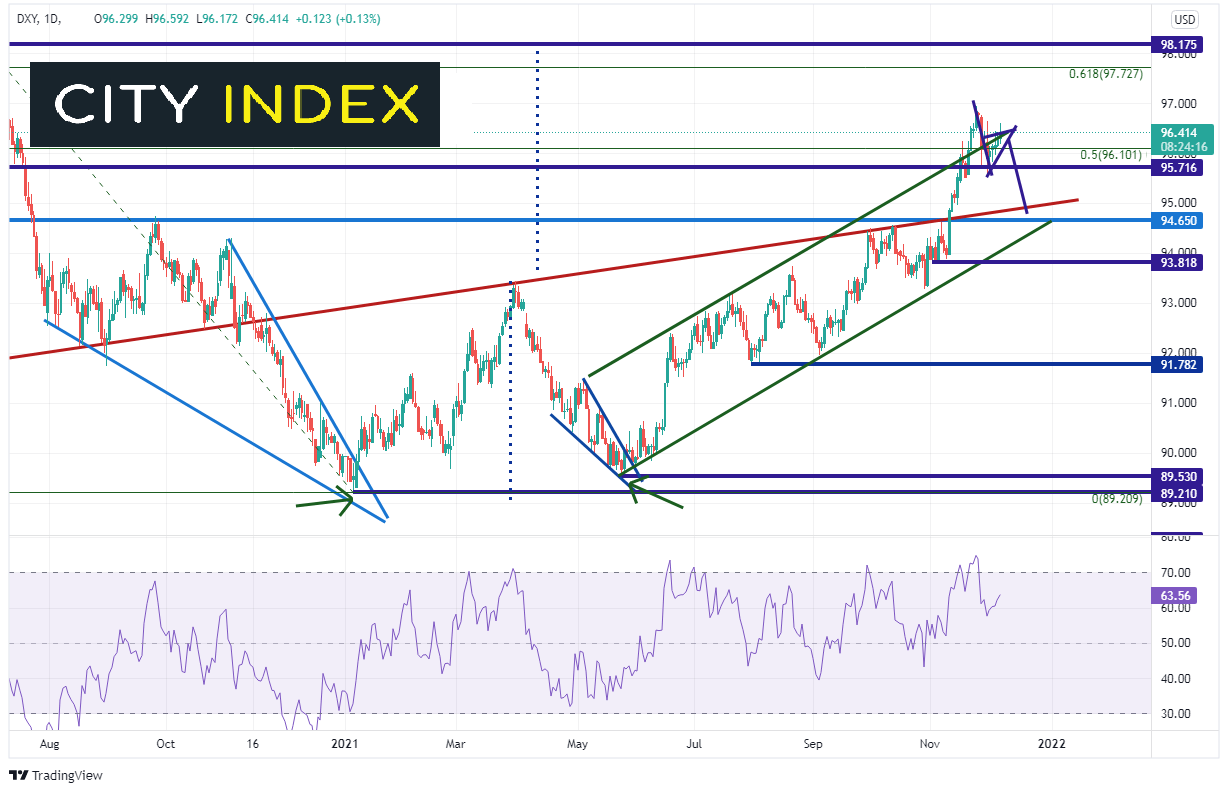
The US Dollar Index (DXY) moved higher on the release of the surprise data, from roughly 96.20 to 96.40. The index has been rising in an orderly channel formation since late May when the DXY broke higher out of a descending wedge near 89.53. On November 19th, the index broke above the top trendline of the channel near 96.10 before pulling back into the channel on November 26th. Price has been hovering between 95.70 and 96.50 since then. Resistance is at the highs on November 23rd of 96.94 and then the 61.8% Fibonacci retracement from the March 2020 highs to the January 2021 lows near 97.73. Horizontal resistance and a double bottom target are near 98.17. However, price may also be flagging for lower. If that is the case and price does break lower, support is at the bottom of the flag pattern near 95.95. The target is near a long-term upward sloping trendline dating to 2011 near 95.09. Below there is the bottom trendline of the channel and horizontal support near 94.65.
Source: Tradingview, Stone X
Trade EUR/USD now: Login or Open a new account!
• Open an account in the UK
• Open an account in Australia
• Open an account in Singapore
EUR/USD has performed similar to, but opposite, the DXY. On the surprise data release, EUR/USD sold off from roughly 1.1250 down to 1.227. The pair had been falling in an orderly downward sloping channel since June 1st, when the pair broke lower out of an ascending wedge near 1.2250. The index broke below the bottom trendline of the channel near 1.1205 before pulling back into the channel on November 25th. Price has been hovering near 1. 1290 since then. EUR/USD is again testing the bottom trendline near 1.1250. If price breaks below, the November 24th low at 1.1186 is the next level of support ahead of horizontal support at 1.1144. Additional horizontal support isn’t until 1.1019! If the trendline holds, horizontal resistance is above at 1.1374, ahead of long-term horizontal resistance at 1.1490.

Source: Tradingview, Stone X
With the higher than expected inflation data today and US CPI on Friday, the DXY many be ready to continue higher and the EUR/USD may continue lower. However, don’t rule out a bout of profit taking ahead of Friday’s data and next week’s FOMC as the Fed decides whether to increase tapering!
Learn more about forex trading opportunities.
Related tags:


The complete CFD trading experience
Award-winning platforms, competitive spreads, low commissions and dedicated support.
We live and breathe the markets and are dedicated to helping traders realise their ambitions as we continue to set the industry bar.
Economic calendar
Web Trader platform
Our sophisticated web-based platform is packed with features.
Related articles
USD/CAD shooting star puts September surge on notice
USD/CAD has printed a clear bearish reversal pattern after an extraordinary September surge, but confirmation may depend heavily on how US Treasury yields react to Friday’s payrolls report.

USD/MXN Analysis: Is Super Peso Starting to Fade?
Over recent trading sessions, the Mexican peso has continued to show signs of weakness against the U.S. dollar. This can already be seen in USD/MXN, which has gained more than 1.7% over the last three sessions, highlighting sustained buying pressure in favor of the dollar in the short term.


Canadian Dollar Analysis: USD/CAD Returns to July Highs Ahead of NFP
The Canadian dollar continues to face one of its most challenging environments in recent months when it comes to maintaining strength against the U.S. dollar. The weakness of the Canadian currency is clearly reflected in USD/CAD, which has now recorded nine consecutive bullish sessions and gained more than 1.7% during that period.
StoneX Europe Ltd may make third party material available on this website which may contain information included but not limited to the conditions of financial markets. The material is for information purposes only and does not contain, and should not be construed as containing, investment advice and/or investment recommendation and/or an investment research and/or an offer of or solicitation for any transactions in financial instruments; any decision to enter into a specific transaction shall be made by the client following an assessment by him/her of their situation.
StoneX Europe Ltd makes no representation or warranty and assumes no liability as to the accuracy or completeness of the information provided, nor any loss arising from any investment based on a recommendation, forecast or other information supplied. You should always seek independent advice as to your suitability to speculate in any related markets and your ability to assume the associated risks, if you are at all unsure. We are not under any obligation to update any such material. Any opinion made may be personal to the author and may not reflect the opinion of StoneX Europe Ltd.