


Norges Bank pumps the brakes on interest rate hikes
The Norges Bank left rates unchanged, however said that it expects to hike rates at the March meeting.
Share this:

Norway’s Norges Bank left rates unchanged at 2.75% during its January meeting, as expected. However, Governor Wolden noted that the policy rate will most likely be raised in March.
Inflation slowed in December to 5.9% YoY from 6.5% YoY in November. This was after peaking 2 months earlier at 7.5% YoY. However, the Core PCE upticked to 5.9% YoY from 5.8% YoY a month earlier. PPI fell dramatically in December to 18.7% YoY after peaking earlier in 2022 near 80% YoY! The committee felt like a pause was needed as “the future policy rate path will depend on economic developments”. In December, the central bank said that the terminal rate would be around 3% this year. Markets are pricing in 3.25%.
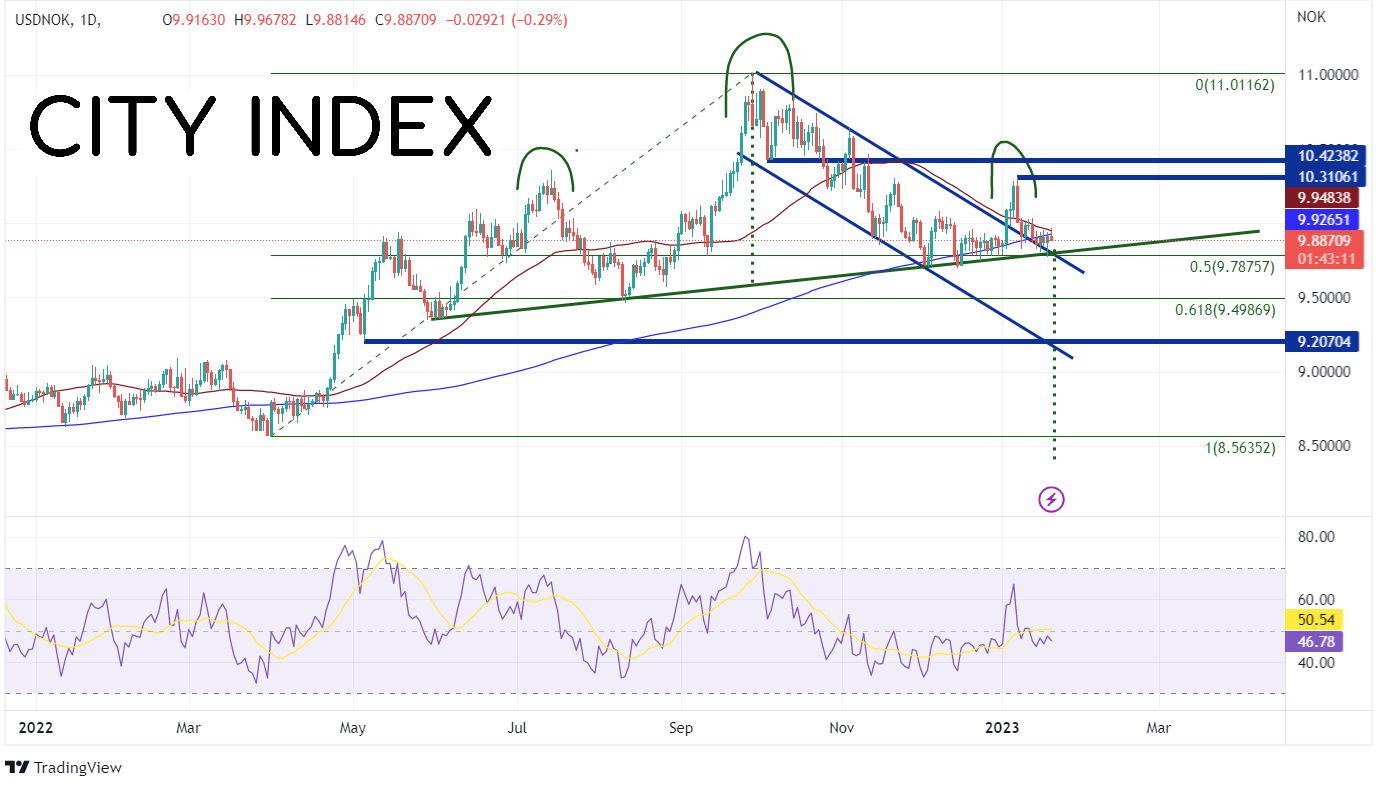
USD/NOK has been moving aggressively higher from March 31st, 2022 to September 28th, 2022 when price peaked at 11.0116. Since then, price has been moving lower in an orderly channel but was halted at support near 9.7876 in December. The support included the 200 Day Moving Average, the bottom trendline of the channel and an upward sloping trendline from the lows of early June 2022. As is often the case, when price fails to break below one side of a channel it moves to test the other side. On January 3rd, price broke above the channel near 9.9987. However, three days later, price made a high of 10.3106 and reversed. USD/NOK is now consolidating around the 50 Day Moving Average, the 200 Day Moving Average, the top trendline of the channel, the long term upward sloping trendline from June 2022, and the 50% retracement from the March 31st lows to the September 28th highs, near 9.8900.

Source: Tradingview, Stone X
Notice that as USD/NOK moved from the March 31st, 2022 lows to today, price formed a head and shoulders formation, with the most recent breakout above the channel forming the right shoulder. Price is currently sitting on a host of support, including the neckline of the pattern, near 9.7875. If USD/NOK breaks the trendline, price could be on its way towards the head and shoulders target near 8.3817. However, it must first pass through additional support at the 61.8% Fibonacci retracement of the above-mentioned timeframe at 9.4987, then the bottom trendline of the channel near 9.1500/9.2000. If price breaks below there, it can run to the March 31st, 2022 lows at 8.5635. If the support does hold and price moves higher, the first resistance is at the highs of February 6th at 10.3106. Above there is horizonal resistance at 10.4238 and then several levels of previous highs on its way to the September 28th high of 11.0116.
The Norges Bank left rates unchanged, however said that it expects to hike rates at the March meeting. USD/NOK is currently at a key confluence of support levels, which if broken, target a big move lower towards the head and shoulders target of 8.3817. However, if the support holds, USD/NOK can move back towards the recent highs of 11.0116.
Norway’s Norges Bank left rates unchanged at 2.75% during its January meeting, as expected. However, Governor Wolden noted that the policy rate will most likely be raised in March.
Inflation slowed in December to 5.9% YoY from 6.5% YoY in November. This was after peaking 2 months earlier at 7.5% YoY. However, the Core PCE upticked to 5.9% YoY from 5.8% YoY a month earlier. PPI fell dramatically in December to 18.7% YoY after peaking earlier in 2022 near 80% YoY! The committee felt like a pause was needed as “the future policy rate path will depend on economic developments”. In December, the central bank said that the terminal rate would be around 3% this year. Markets are pricing in 3.25%.
USD/NOK has been moving aggressively higher from March 31st, 2022 to September 28th, 2022 when price peaked at 11.0116. Since then, price has been moving lower in an orderly channel but was halted at support near 9.7876 in December. The support included the 200 Day Moving Average, the bottom trendline of the channel and an upward sloping trendline from the lows of early June 2022. As is often the case, when price fails to break below one side of a channel it moves to test the other side. On January 3rd, price broke above the channel near 9.9987. However, three days later, price made a high of 10.3106 and reversed. USD/NOK is now consolidating around the 50 Day Moving Average, the 200 Day Moving Average, the top trendline of the channel, the long term upward sloping trendline from June 2022, and the 50% retracement from the March 31st lows to the September 28th highs, near 9.8900.
Source: Tradingview, Stone X
Trade USD/NOK now: Login or Open a new account!
• Open an account in the UK
• Open an account in Australia
• Open an account in Singapore
Notice that as USD/NOK moved from the March 31st, 2022 lows to today, price formed a head and shoulders formation, with the most recent breakout above the channel forming the right shoulder. Price is currently sitting on a host of support, including the neckline of the pattern, near 9.7875. If USD/NOK breaks the trendline, price could be on its way towards the head and shoulders target near 8.3817. However, it must first pass through additional support at the 61.8% Fibonacci retracement of the above-mentioned timeframe at 9.4987, then the bottom trendline of the channel near 9.1500/9.2000. If price breaks below there, it can run to the March 31st, 2022 lows at 8.5635. If the support does hold and price moves higher, the first resistance is at the highs of February 6th at 10.3106. Above there is horizonal resistance at 10.4238 and then several levels of previous highs on its way to the September 28th high of 11.0116.
The Norges Bank left rates unchanged, however said that it expects to hike rates at the March meeting. USD/NOK is currently at a key confluence of support levels, which if broken, target a big move lower towards the head and shoulders target of 8.3817. However, if the support holds, USD/NOK can move back towards the recent highs of 11.0116.
Learn more about forex trading opportunities.
Related tags:
Latest market news




The complete CFD trading experience
Award-winning platforms, competitive spreads, low commissions and dedicated support.
We live and breathe the markets and are dedicated to helping traders realise their ambitions as we continue to set the industry bar.
Economic calendar
Web Trader platform
Our sophisticated web-based platform is packed with features.
Related articles
USD/CAD reversal risk builds as central bank showdown looms
USD/CAD has delivered a bullish reversal signal from established support, just as traders prepare for Fed and BoC decisions. Aggressive Canadian rate hike expectations and conflicting momentum signals make the coming session important.
EUR/USD weekly outlook: FOMC and ECB to set the tone
The current backdrop is modestly bearish. On Friday, the EUR/USD closed modestly lower, down for the third consecutive day. The pair also posted a weekly decline after staging a modest recovery attempt in the previous week. Out of the past 8 weeks, the EUR/USD has fallen on 6 occasions. There is not much supporting factors for the single currency right now. So, the upside remains capped.


USD/JPY Forecast: Is Rising Japanese Inflation Supporting the Yen?
As the trading week comes to an end, one of the most relevant developments in the FX market has been the renewed strength of the Japanese yen. This can be seen in the recent performance of USD/JPY, which has fallen nearly 1.0% over the last two trading sessions, highlighting a meaningful recovery in the Japanese currency against the U.S. dollar.

StoneX Europe Ltd may make third party material available on this website which may contain information included but not limited to the conditions of financial markets. The material is for information purposes only and does not contain, and should not be construed as containing, investment advice and/or investment recommendation and/or an investment research and/or an offer of or solicitation for any transactions in financial instruments; any decision to enter into a specific transaction shall be made by the client following an assessment by him/her of their situation.
StoneX Europe Ltd makes no representation or warranty and assumes no liability as to the accuracy or completeness of the information provided, nor any loss arising from any investment based on a recommendation, forecast or other information supplied. You should always seek independent advice as to your suitability to speculate in any related markets and your ability to assume the associated risks, if you are at all unsure. We are not under any obligation to update any such material. Any opinion made may be personal to the author and may not reflect the opinion of StoneX Europe Ltd.