



Oil-palooza!?
The US may release up to 35 million barrels of oil
Share this:

Last week, after Joe Biden got off the phone with China’s President XI, China announced they would be releasing oil from their reserves. Whether that was the reason China released oil from their National Food and Strategic Reserves or not, doesn’t really matter. (China also released oil from their reserves back in September). However, upon Joe Biden’s urging, today Japan and India also released oil from their own reserves. Later in the day, the US followed suit and announced it would be releasing oil from is Strategic Petroleum Reserves. The amounts and timing of the release for each country is still undecided, however the US may release up to 35 million barrels of oil. South Korea may be next to announce.
What factors move the price of oil?
But what does that mean for OPEC+ when they meet again at their next meeting on December? Probably not much. The release from the SPRs is already priced into the market. As we wrote last week, prices may have been moving lower on speculation that these countries may release oil from their reserves. In addition, OPEC+ had said at their last meeting that they would not increase supply due to the lack of the demand from the uncertainty around the coronavirus. With the reemergence of the virus in Europe, their outlook probably won’t change much when they meet in early December. So how much more room could WTI have on the downside?
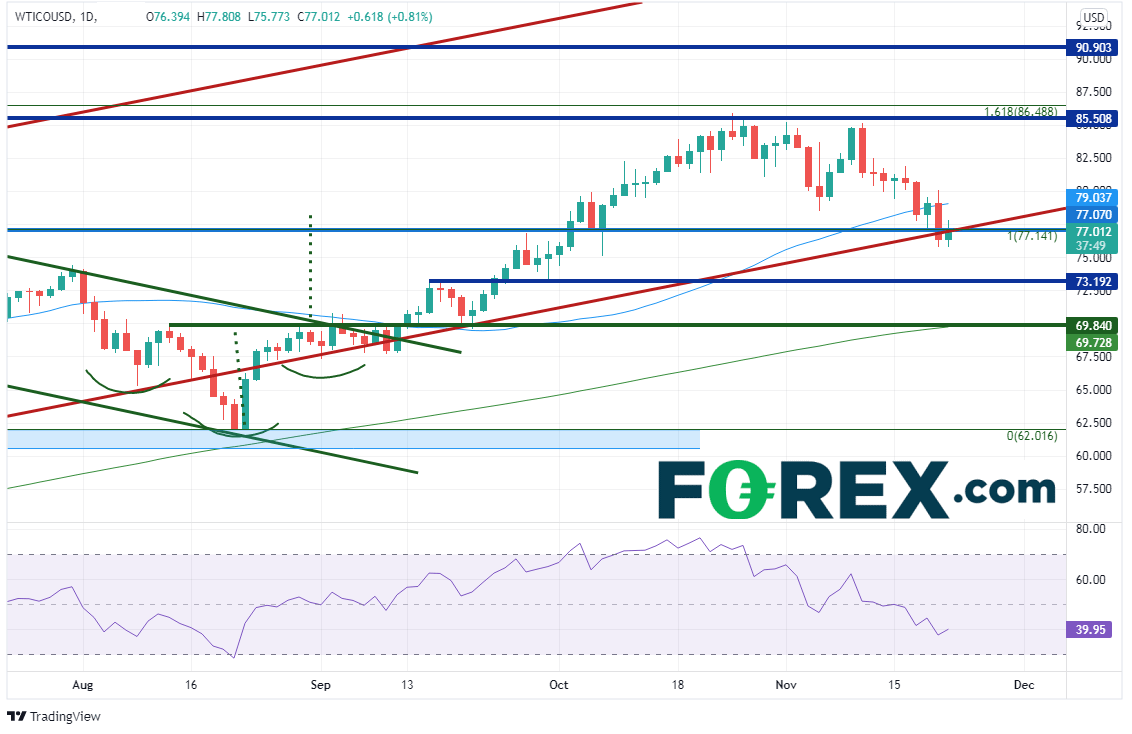
WTI crude oil had been moving lower since it put in a bearish engulfing candlestick on November 10th, from 85.15. Today, price reached a low of 75.77.
Source: Tradingview, Stone X
Oil pulled back to the 38.2% Fibonacci retracement level from the lows of August 22nd to the highs of October 25th. The price pattern on a 240-minute timeframe targets just below 74.00, which is also the 50% retracement from the same timeframe.

Source: Tradingview, Stone X
Trade USD/CAD now: Login or open a new account!
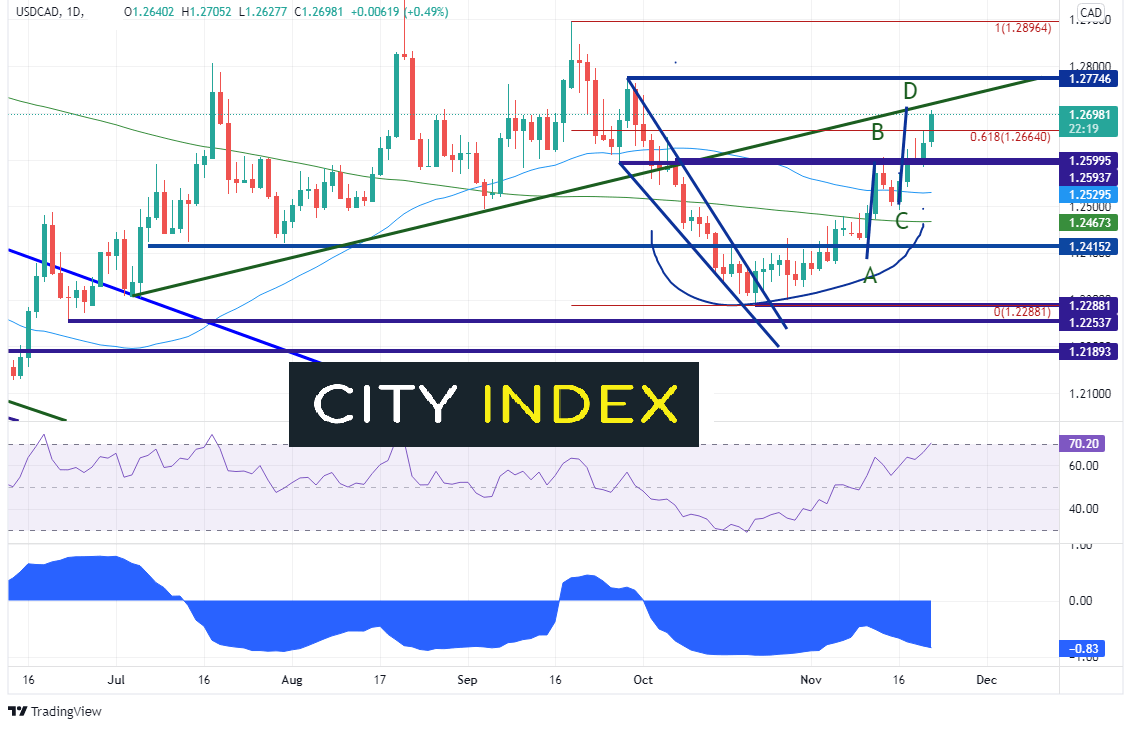
The correlation coefficient between WTI can USD/CAD is -0.83. As we often discuss, USD/CAD and Crude oil have an inverse correlation. Anything below -0.80 is considered a strong negative correlation. On a daily timeframe, USD/CAD broke through the 61.8% Fibonacci retracement from the September 20th highs to the October 21st lows at 1.2664 and rose to the target of the AB=CD formation, near 1.2710. In addition, the pair stalled at the upward sloping trendline dating back to July 5th.

Source: Tradingview, Stone X
Both Crude Oil and USD/CAD at support and resistance, respectively, on the daily timeframe. If WTI crude oil holds, USD/CAD may move lower. However, if WTI does complete the flag pattern on the 240-minute timeframe, one USD/CAD may push incrementally higher and reach the target for the descending wedge and horizontal resistance at 1.2775!
Whatever the reason that crude moved lower, one has to wonder how much room WTI has on the downside. Is it a “sell the rumor, buy the fact”, or was it lower due to the expected lack of demand? With the increase in oil from the SPRs, OPEC+ is likely still on hold at the next meeting, which may give Crude a bounce and may push USD/CAD lower!
Learn more about forex trading opportunities.
Last week, after Joe Biden got off the phone with China’s President XI, China announced they would be releasing oil from their reserves. Whether that was the reason China released oil from their National Food and Strategic Reserves or not, doesn’t really matter. (China also released oil from their reserves back in September). However, upon Joe Biden’s urging, today Japan and India also released oil from their own reserves. Later in the day, the US followed suit and announced it would be releasing oil from is Strategic Petroleum Reserves. The amounts and timing of the release for each country is still undecided, however the US may release up to 35 million barrels of oil. South Korea may be next to announce.
What factors move the price of oil?
But what does that mean for OPEC+ when they meet again at their next meeting on December? Probably not much. The release from the SPRs is already priced into the market. As we wrote last week, prices may have been moving lower on speculation that these countries may release oil from their reserves. In addition, OPEC+ had said at their last meeting that they would not increase supply due to the lack of the demand from the uncertainty around the coronavirus. With the reemergence of the virus in Europe, their outlook probably won’t change much when they meet in early December. So how much more room could WTI have on the downside?
WTI crude oil had been moving lower since it put in a bearish engulfing candlestick on November 10th, from 85.15. Today, price reached a low of 75.77.

Source: Tradingview, Stone X
Oil pulled back to the 38.2% Fibonacci retracement level from the lows of August 22nd to the highs of October 25th. The price pattern on a 240-minute timeframe targets just below 74.00, which is also the 50% retracement from the same timeframe.

Source: Tradingview, Stone X
Trade USD/CAD now: Login or Open a new account!
• Open an account in the UK
• Open an account in Australia
• Open an account in Singapore
The correlation coefficient between WTI can USD/CAD is -0.83. As we often discuss, USD/CAD and Crude oil have an inverse correlation. Anything below -0.80 is considered a strong negative correlation. On a daily timeframe, USD/CAD broke through the 61.8% Fibonacci retracement from the September 20th highs to the October 21st lows at 1.2664 and rose to the target of the AB=CD formation, near 1.2710. In addition, the pair stalled at the upward sloping trendline dating back to July 5th.
Source: Tradingview, Stone X
Both Crude Oil and USD/CAD at support and resistance, respectively, on the daily timeframe. If WTI crude oil holds, USD/CAD may move lower. However, if WTI does complete the flag pattern on the 240-minute timeframe, one USD/CAD may push incrementally higher and reach the target for the descending wedge and horizontal resistance at 1.2775!
Whatever the reason that crude moved lower, one has to wonder how much room WTI has on the downside. Is it a “sell the rumor, buy the fact”, or was it lower due to the expected lack of demand? With the increase in oil from the SPRs, OPEC+ is likely still on hold at the next meeting, which may give Crude a bounce and may push USD/CAD lower!
Learn more about forex trading opportunities.
Related tags:
Latest market news




The complete CFD trading experience
Award-winning platforms, competitive spreads, low commissions and dedicated support.
We live and breathe the markets and are dedicated to helping traders realise their ambitions as we continue to set the industry bar.
Economic calendar
Web Trader platform
Our sophisticated web-based platform is packed with features.
Related articles
USD/MXN Analysis: Is Super Peso Starting to Fade?
Over recent trading sessions, the Mexican peso has continued to show signs of weakness against the U.S. dollar. This can already be seen in USD/MXN, which has gained more than 1.7% over the last three sessions, highlighting sustained buying pressure in favor of the dollar in the short term.
Canadian Dollar Analysis: USD/CAD Returns to July Highs Ahead of NFP
The Canadian dollar continues to face one of its most challenging environments in recent months when it comes to maintaining strength against the U.S. dollar. The weakness of the Canadian currency is clearly reflected in USD/CAD, which has now recorded nine consecutive bullish sessions and gained more than 1.7% during that period.

US Dollar Technical Outlook: DXY Bulls Meet Resistance at Yearly Highs 10 1 2026
The U.S. Dollar has held firm despite fading Fed hike bets, but Friday’s payrolls could test the rally’s staying power.

StoneX Europe Ltd may make third party material available on this website which may contain information included but not limited to the conditions of financial markets. The material is for information purposes only and does not contain, and should not be construed as containing, investment advice and/or investment recommendation and/or an investment research and/or an offer of or solicitation for any transactions in financial instruments; any decision to enter into a specific transaction shall be made by the client following an assessment by him/her of their situation.
StoneX Europe Ltd makes no representation or warranty and assumes no liability as to the accuracy or completeness of the information provided, nor any loss arising from any investment based on a recommendation, forecast or other information supplied. You should always seek independent advice as to your suitability to speculate in any related markets and your ability to assume the associated risks, if you are at all unsure. We are not under any obligation to update any such material. Any opinion made may be personal to the author and may not reflect the opinion of StoneX Europe Ltd.