






Ripple Effects of Coronavirus
The Coronavirus also is having a large impact on the economy in Norway.
Share this:

The Coronavirus is having fallout effects on other markets besides those related to China, Southeast Asia, and even global stock markets. Light Crude Oil Futures have been on a one-way street since January 8th, when Iran used drone attacks on American bases in Iraq. The high on that day was 65.65. Today’s low, a mere three weeks later, is 52.13. Crude paused on is move lower near an upward sloping trendline and the 200 Day Moving Average around 58.00 as the US-China Phase One trade deal was signed. However, once fears of spread of the Coronavirus started making its way around the market, that level was broken by a bearish engulfing candle and price hasn’t looked back since. Fears are that a slowdown in China will occur and the demand for oil will be reduced, hence pushing price lower. Crude is nearing support at 51.00 and the RSI is oversold, so perhaps a bounce is ahead.
Source, Tradingview, NYMEX, City Index
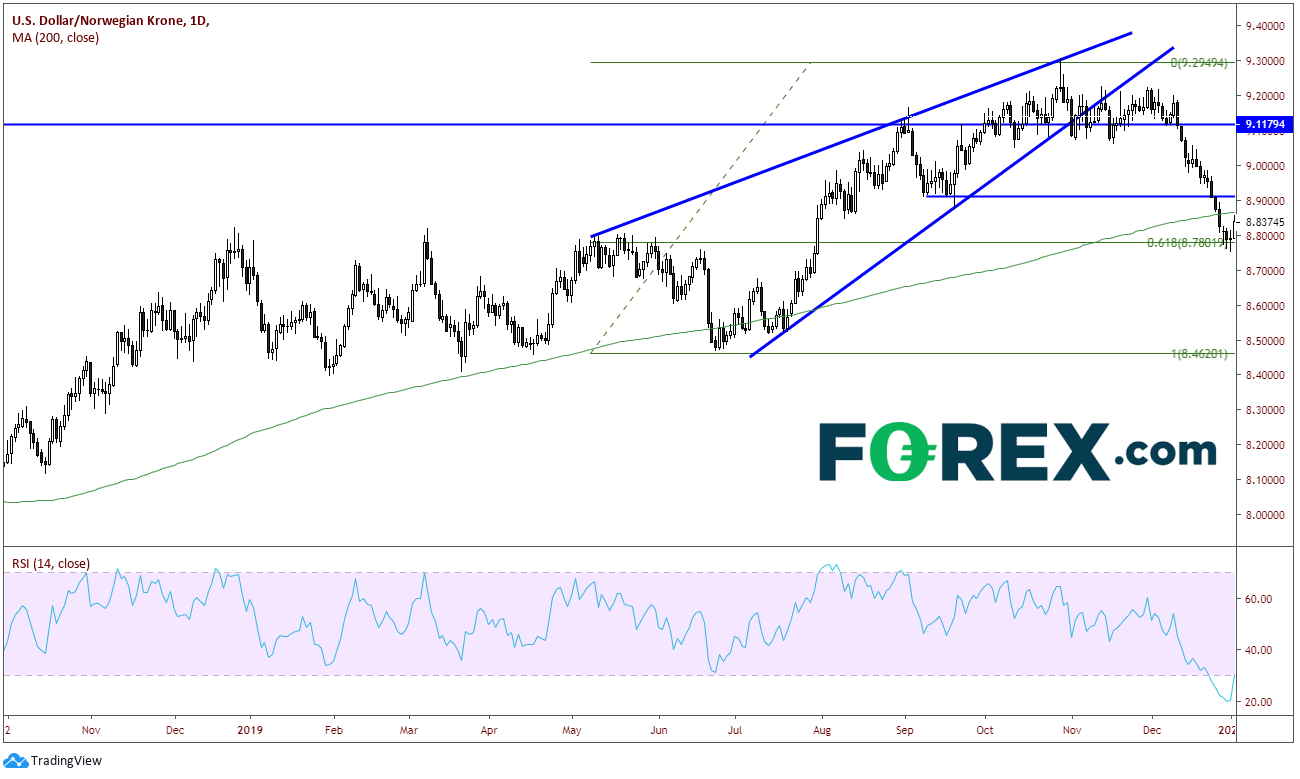
The Coronavirus also is having a large impact on the economy in Norway. The reason is not that the virus is spreading all over the country. The reason is that the Coronavirus is affecting the value of the Norwegian Krone! On a daily timeframe, we can see that in December the price of USD/NOK had begun falling after price broke out of the rising wedge. The target for the breakdown of a rising wedge is 100% of the wedge. At the end of 2019, USD/NOK had retraced 61.8% of the low from June 24th, 2019 to the highs October 29th near 8.787.
Source, Tradingview, City Index
On a 240-minute chart, we can see that since the beginning of 2020, USD/NOK has bounced off support and moved higher. Norway is an oil exporting led country. So, the value of Crude has a direct impact on the price of the Krone. In the bottom panel is the correlation coefficient between Crude and USD/NOK. There is currently a -.89-correlation coefficient for the two instruments. A reading of -1.00 means that the two are perfectly inversely correlated. The current reading suggests the when the price is crude is moving lower, the price of USD/NOK is moving higher.
Source, Tradingview, NYMEX, City Index
However, notice that USD/NOK is currently in a resistance zone near 9.1500/9.2000. The RSI is overbought and above 80 (extreme overbought) and is turning down. This indicates that pair may be ready for a pullback, especially if the price of crude holds and moves higher.
If news suggests that the Coronavirus is spreading, it may suggest a larger slowdown in China, which means less demand for oil. If there is a lower demand for oil, USD/NOK may continue to rise. However, if the virus is contained, it may put a bid in oil and as a result, USD/NOK may move lower.
The Coronavirus is having fallout effects on other markets besides those related to China, Southeast Asia, and even global stock markets. Light Crude Oil Futures have been on a one-way street since January 8th, when Iran used drone attacks on American bases in Iraq. The high on that day was 65.65. Today’s low, a mere three weeks later, is 52.13. Crude paused on is move lower near an upward sloping trendline and the 200 Day Moving Average around 58.00 as the US-China Phase One trade deal was signed. However, once fears of spread of the Coronavirus started making its way around the market, that level was broken by a bearish engulfing candle and price hasn’t looked back since. Fears are that a slowdown in China will occur and the demand for oil will be reduced, hence pushing price lower. Crude is nearing support at 51.00 and the RSI is oversold, so perhaps a bounce is ahead.
Source, Tradingview, NYMEX, FOREX.com
The Coronavirus also is having a large impact on the economy in Norway. The reason is not that the virus is spreading all over the country. The reason is that the Coronavirus is affecting the value of the Norwegian Krone! On a daily timeframe, we can see that in December the price of USD/NOK had begun falling after price broke out of the rising wedge. The target for the breakdown of a rising wedge is 100% of the wedge. At the end of 2019, USD/NOK had retraced 61.8% of the low from June 24th, 2019 to the highs October 29th near 8.787.
Source, Tradingview, FOREX.com
On a 240-minute chart, we can see that since the beginning of 2020, USD/NOK has bounced off support and moved higher. Norway is an oil exporting led country. So, the value of Crude has a direct impact on the price of the Krone. In the bottom panel is the correlation coefficient between Crude and USD/NOK. There is currently a -.89-correlation coefficient for the two instruments. A reading of -1.00 means that the two are perfectly inversely correlated. The current reading suggests the when the price is crude is moving lower, the price of USD/NOK is moving higher.
Source, Tradingview, NYMEX, FOREX.com
However, notice that USD/NOK is currently in a resistance zone near 9.1500/9.2000. The RSI is overbought and above 80 (extreme overbought) and is turning down. This indicates that pair may be ready for a pullback, especially if the price of crude holds and moves higher.
If news suggests that the Coronavirus is spreading, it may suggest a larger slowdown in China, which means less demand for oil. If there is a lower demand for oil, USD/NOK may continue to rise. However, if the virus is contained, it may put a bid in oil and as a result, USD/NOK may move lower.
Latest market news




The complete CFD trading experience
Award-winning platforms, competitive spreads, low commissions and dedicated support.
We live and breathe the markets and are dedicated to helping traders realise their ambitions as we continue to set the industry bar.
Economic calendar
Web Trader platform
Our sophisticated web-based platform is packed with features.
Related articles
EUR/USD, USD/JPY Outlook: Oil, yields and an FX identity crisis
Crude oil is setting the tone across rates and FX, leaving EUR/USD vulnerable and USD/JPY caught between higher Treasury yields and the growing threat of intervention
AUD/USD Analysis: What's Next for the Australian Dollar After the RBA Decision?
Recent trading sessions have reflected a more neutral tone around the Australian dollar. This can be seen in AUD/USD price action, which has posted moves of roughly 0.2% over the last two sessions without establishing a clear direction. Much of this lack of momentum is linked to expectations surrounding the next policy moves from both the Reserve Bank of Australia (RBA) and the Federal Reserve.

USD into a Massive Week as Yields Fly and Gold Breaks
It’s a huge week with PCE and NFP, but it’s what’s happening off of the calendar that demands attention with US yields flying to fresh multi-decade highs.

StoneX Europe Ltd may make third party material available on this website which may contain information included but not limited to the conditions of financial markets. The material is for information purposes only and does not contain, and should not be construed as containing, investment advice and/or investment recommendation and/or an investment research and/or an offer of or solicitation for any transactions in financial instruments; any decision to enter into a specific transaction shall be made by the client following an assessment by him/her of their situation.
StoneX Europe Ltd makes no representation or warranty and assumes no liability as to the accuracy or completeness of the information provided, nor any loss arising from any investment based on a recommendation, forecast or other information supplied. You should always seek independent advice as to your suitability to speculate in any related markets and your ability to assume the associated risks, if you are at all unsure. We are not under any obligation to update any such material. Any opinion made may be personal to the author and may not reflect the opinion of StoneX Europe Ltd.