





S&P 500 outlook: Stocks rebound amid speculation on tariffs compromise and German spending plan
US Commerce Secretary Howard Lutnick hinted at a compromise on tariffs on Tuesday, while Trump himself acknowledged that there may be an “adjustment period” to tariffs. The key question for the near-term S&P 500 outlook now is whether the recovery will hold?
Share this:

US index futures were trading higher by mid-morning European session, tracking a firmer tone in Europe, where the major indices like the German DAX approached their all-time highs, boosted by industrial stocks such as Heidelberg Materials. Sentiment has been supported in part because of plans by German Chancellor-in-waiting Friedrich Merz to amend the country’s constitution to exempt defence and security outlays from fiscal spending limits. This will pave the way for a €500 billion infrastructure fund to invest in transportation, energy grids, and housing over 10 years. Also helping sentiment was speculation US trade tariffs may be dialled down…because of the stock market drop. US Commerce Secretary Howard Lutnick hinted at a compromise on tariffs on Tuesday, while Trump himself acknowledged that there may be an “adjustment period” to tariffs. The key question for the near-term S&P 500 outlook now is whether the recovery will hold?
Trade war turmoil erased post-election gains
The rebound follows a bruising session in global markets in recent days, where investors were sent scrambling for cover. Heightened concerns over an escalating trade war saw traders flock to haven assets—short-term bonds, gold, and safe-haven currencies like the yen. Meanwhile, risk-sensitive assets bore the brunt of the selling pressure, including equities, crude oil, and even cryptocurrencies. The S&P 500 was not spared, erasing the entirety of its multi-trillion-dollar rally since the last US election. However, a late-session attempt at stabilisation managed to limit losses, leaving major indices well off their worst levels by the close.
Market jitters: Is the sell-off justified?
Undoubtedly, tariffs have played a significant role in shaking investor confidence, but other factors are at play. Concerns around stretched valuations and profit-taking have also contributed to the sell-off. However, the sharp acceleration in selling pressure was largely triggered by the US implementing one of its most expansive tariff regimes in recent memory. The White House has taken aim at a broad swathe of imports from China, Canada, and Mexico, prompting swift retaliatory measures.
But after the US Commerce Secretary Lutnick hinted at a compromise on tariffs on Tuesday, while Trump himself acknowledged that there may be an “adjustment period” to tariffs, markets have stabilised somewhat. The pressing question now is whether the market rout has run its course—or if further turbulence lies ahead.
Key economic data in focus: ISM and NFP
Amid the trade war narrative, economic data will come back under the spotlight. Weaker-than-expected data has reinforced concerns over slowing global growth, with traders now pricing in three quarter-point rate cuts by the Federal Reserve this year. However, incoming reports this week could see expectations shift yet again.
Recent US data has presented a mixed picture. Consumer confidence indicators have disappointed, while cracks are appearing in the housing sector. Additionally, last week’s S&P Global flash services PMI, a leading indicator for the ISM PMI, slipped into contraction territory. Investors will be keenly watching today’s ISM PMI release—should it follow the same path, speculation around Fed rate cuts could intensify. A reading of 52.5 is expected compared to 52.8 in the previous month.
Attention will then turn to the ECB rate decision on Thursday, followed by Friday’s US monthly non-farm payrolls (NFP) report. January’s payrolls data caught markets off guard with stronger-than-expected wage growth, as average hourly earnings surged by 0.5% month-on-month. Despite an underwhelming headline jobs figure, upward revisions to prior months offset the disappointment. The broader trend suggests that while economic momentum is waning, inflationary pressures remain a concern for policymakers. If upcoming data continues to signal economic weakness, expectations for rate cuts will likely rise, providing a potential cushion for equities amid ongoing trade tensions.
S&P 500 outlook: Technical levels to watch
Source: TradingView.com
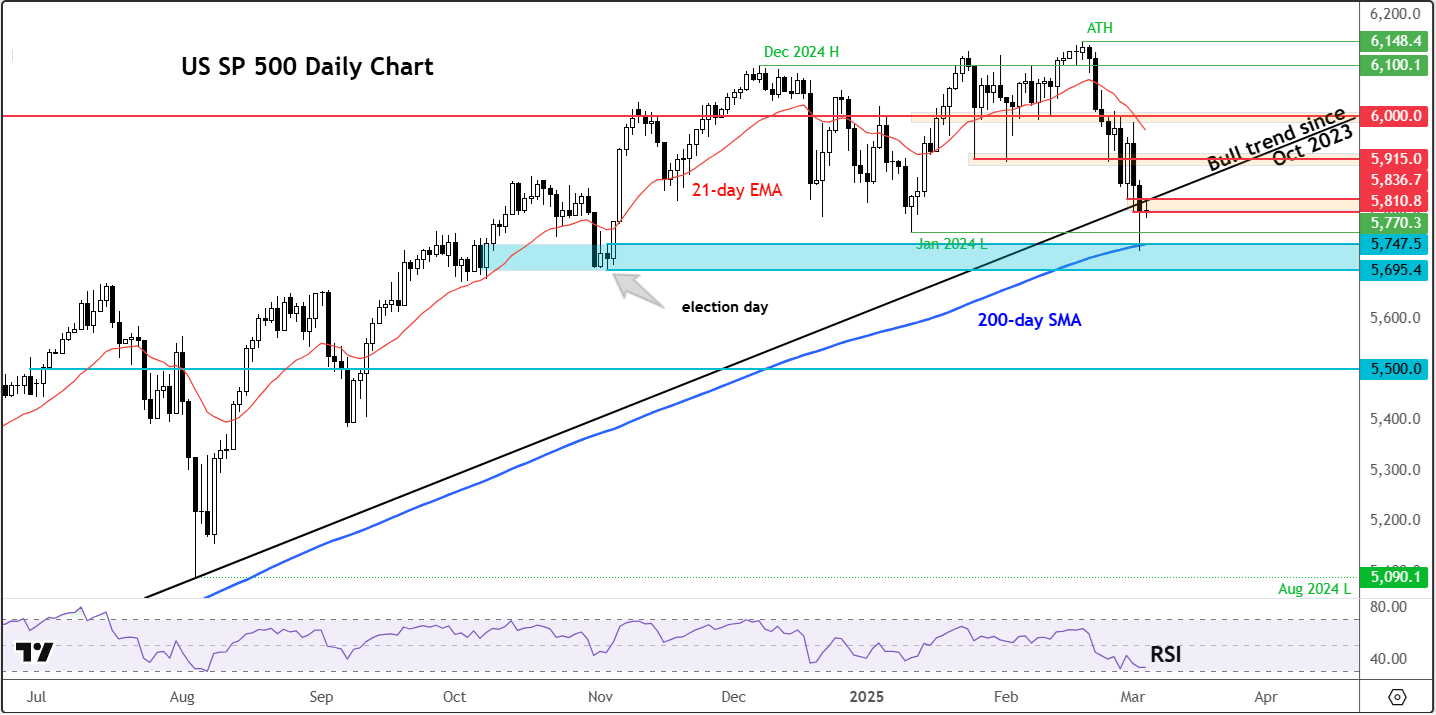
Yesterday’s rebound coincided with the S&P 500 and Nasdaq 100 both dipping below their crucial 200-day moving averages before bouncing back above it. Notably, individual stocks such as MicroStrategy and Oracle saw similar rebounds, while Nvidia stock found firm support around $110, Tesla defended $265, and Alphabet held its trendline support at $170. The question now is whether this technical buying will translate into sustained upside momentum—or if renewed selling pressure will emerge.
From a technical perspective, the S&P 500 tested a critical support zone between 5695 and 5747 —an area marking the origins of the Trump rally. The 200-day moving average aligns with this region, further underscoring its significance. With the daily RSI hovering near 30, the index appears somewhat oversold in the short term, potentially attracting dip buyers.
However, resistance looms overhead. Yesterday’s recovery attempt stalled around the 5810 mark, with additional resistance emerging at 5837—the backside of the broken trendline dating back to October 2023. A sustained break above this 5810-5837 zone would indicate a meaningful bullish reversal, potentially paving the way for a broader recovery.
Conversely, should selling pressure resume and the S&P 500 breach the 5695-5747 range, the market could be in for a deeper correction—one that has been notably absent in the last couple of years. With volatility running high, all eyes will be on whether the index can stabilise or if further downside lies ahead.
-- Written by Fawad Razaqzada, Market Analyst
Follow Fawad on Twitter @Trader_F_R
How to trade with City Index
You can trade with City Index by following these four easy steps:
- Open an account, or log in if you’re already a customer
• Open an account in the UK
• Open an account in Australia
• Open an account in Singapore
- Search for the company you want to trade in our award-winning platform
- Choose your position and size, and your stop and limit levels
- Place the trade
Related tags:



The complete CFD trading experience
Award-winning platforms, competitive spreads, low commissions and dedicated support.
We live and breathe the markets and are dedicated to helping traders realise their ambitions as we continue to set the industry bar.
Economic calendar
Web Trader platform
Our sophisticated web-based platform is packed with features.
Related articles

USD/CAD forecast: rally could accelerate above June highs at 1.4250
USD/CAD recovered quickly after weaker US jobs data, keeping the bullish trend in focus. A move above the June highs could accelerate the rally as inflation keeps the Fed under pressure.

Dow Jones Slide Shows What Rate Hike Bets Mean for Stocks
The Dow Jones support breakdown shows rising bond yields and rate hike bets hitting U.S. stocks while tech giants prop up the Nasdaq.

EUR/USD forecast remains tilted lower with French bond troubles ahead of US jobs report
The EUR/USD has tagged a fresh year-to-date low as French public-finance concerns trigger a government bond sell-off. Today's US jobs report may change little, with resilient activity, elevated energy prices and hawkish Fed bets keeping the greenback supported. With the pair trapped below resistance at 1.1410, the risk to the near-term EUR/USD forecast is tilted to the downside.
StoneX Europe Ltd may make third party material available on this website which may contain information included but not limited to the conditions of financial markets. The material is for information purposes only and does not contain, and should not be construed as containing, investment advice and/or investment recommendation and/or an investment research and/or an offer of or solicitation for any transactions in financial instruments; any decision to enter into a specific transaction shall be made by the client following an assessment by him/her of their situation.
StoneX Europe Ltd makes no representation or warranty and assumes no liability as to the accuracy or completeness of the information provided, nor any loss arising from any investment based on a recommendation, forecast or other information supplied. You should always seek independent advice as to your suitability to speculate in any related markets and your ability to assume the associated risks, if you are at all unsure. We are not under any obligation to update any such material. Any opinion made may be personal to the author and may not reflect the opinion of StoneX Europe Ltd.