







Significant trading volumes on the VIX hints at cycle low: COT report
When open interest on the VIX rises at its second largest weekly pace on record, it’s best to take notice. Especially when it reached a 5-year low before snapping a 4-week losing streak. We also take a look at positioning on the USD index, EUR/USD, GBP/USD, NZD/USD, gold and WTI crude oil.
Share this:

View the latest commitment of traders reports
View the latest commitment of traders reports
When the rise of open interest rises at its second weekly pace on record for the VIX, it’s best to take notice. Especially when it reached a 5-year low before snapping a 4-weeklosing streak. We also take a look at positioning on the USD index, EUR/USD, GBP/USD, NZD/USD, gold and WTI crude oil.
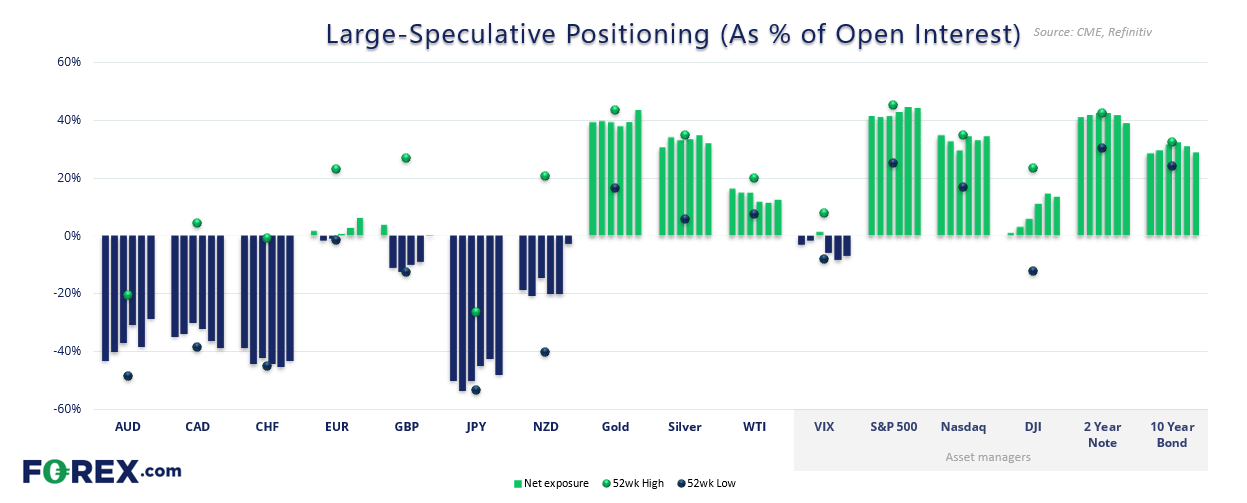
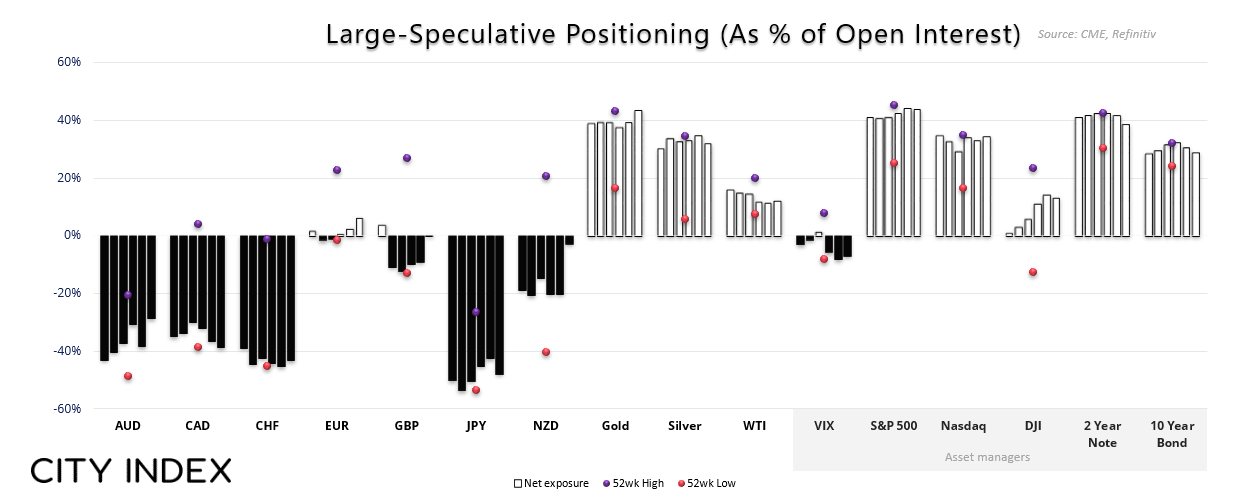
Market positioning from the COT report - as of Tuesday May 21, 2024:
- Futures traders reduced net-long exposure to the US dollar for a fourth week according to the IMM, at a rate of -$4.8 billion last week
- Net-long exposure to EUR/USD futures rose for a third week, to a 9-week high
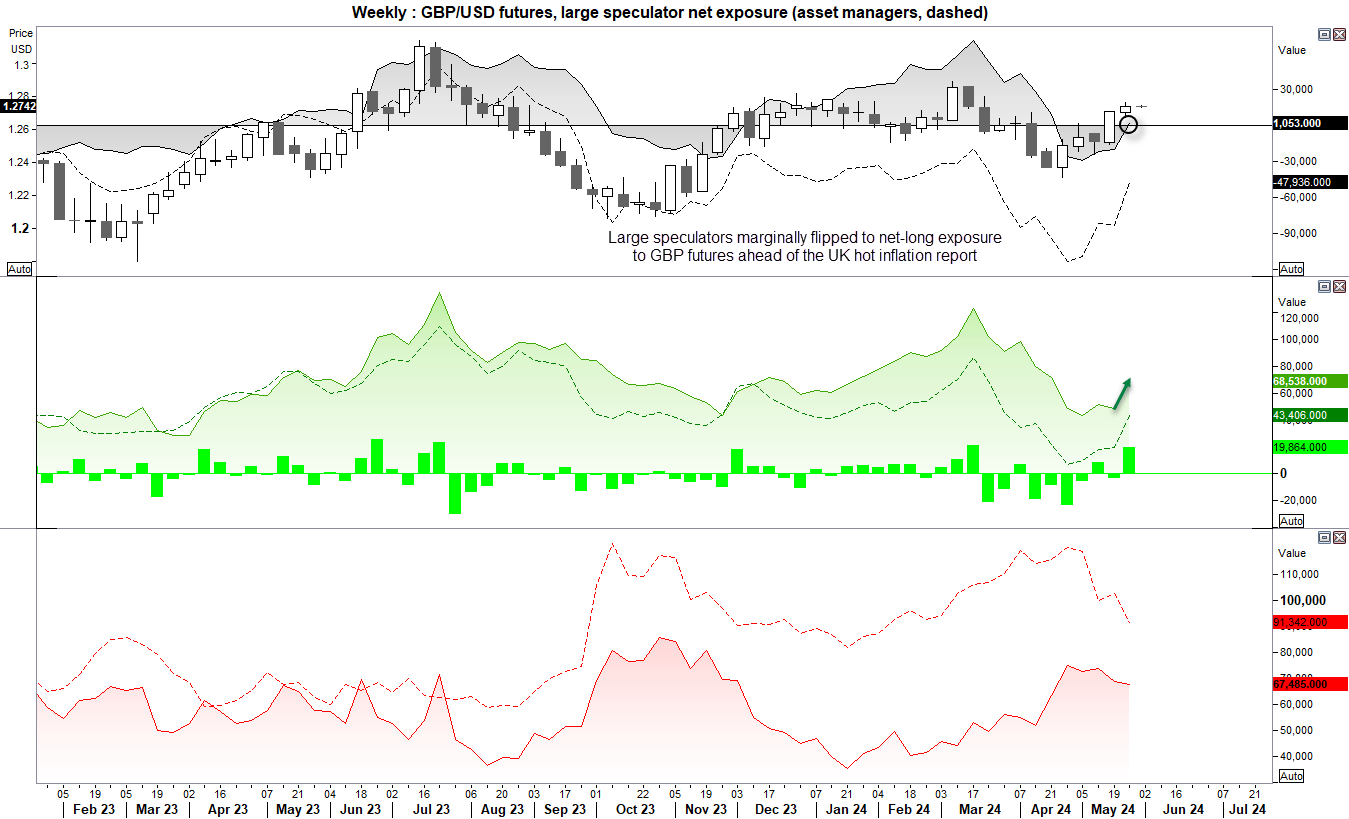
- Large speculators flipped to net-long exposure to GBP/USD futures, with long contracts rising 40.8% (19.8k)
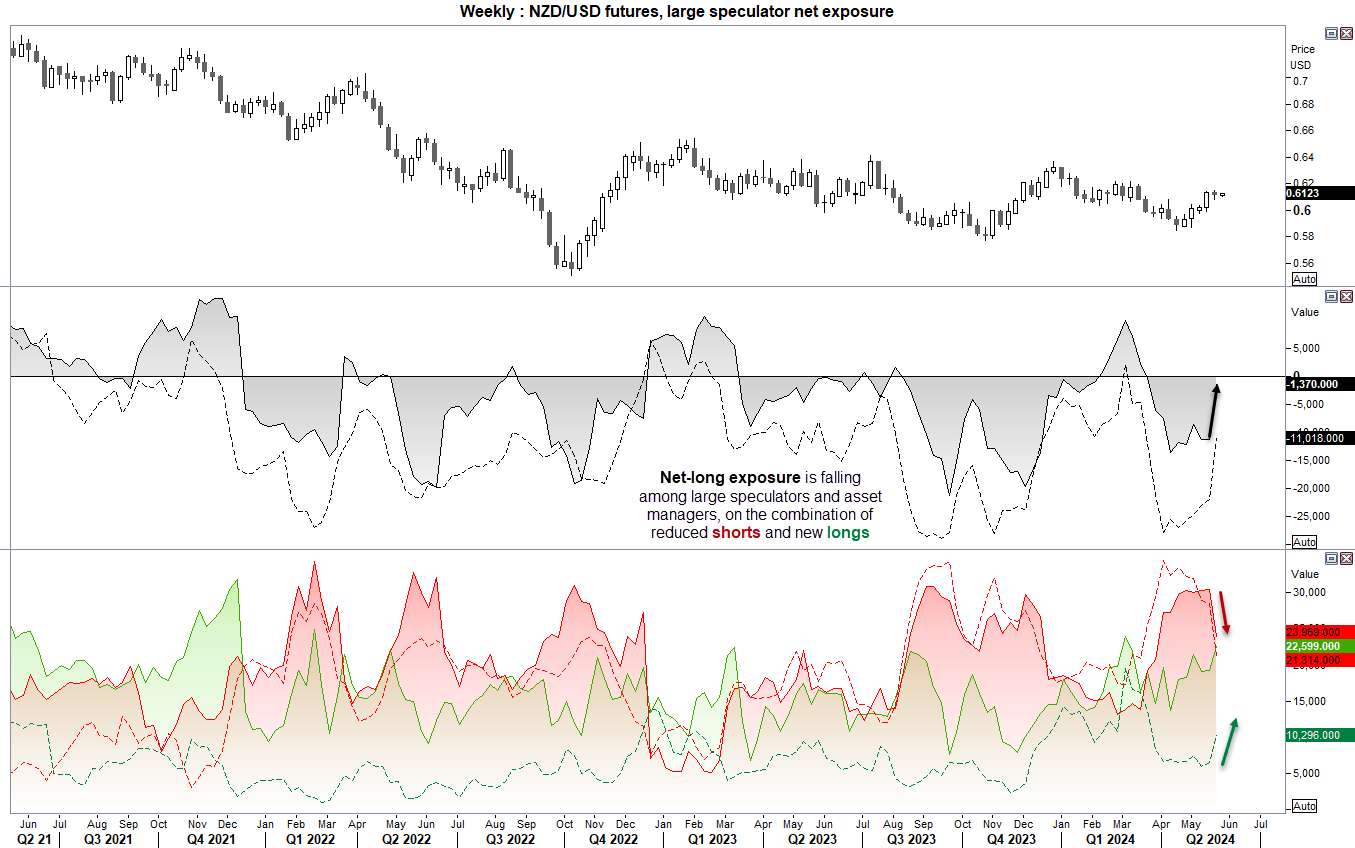
- They also increased net-long exposure to NZD/USD futures by 9.8 contracts (longs increased by 17.2%, shorts were lower by -21.4%)
- Net-short exposure to CAD futures rose to a near 7-year high
- Net-short exposure to JPY futures increased for the first week in four
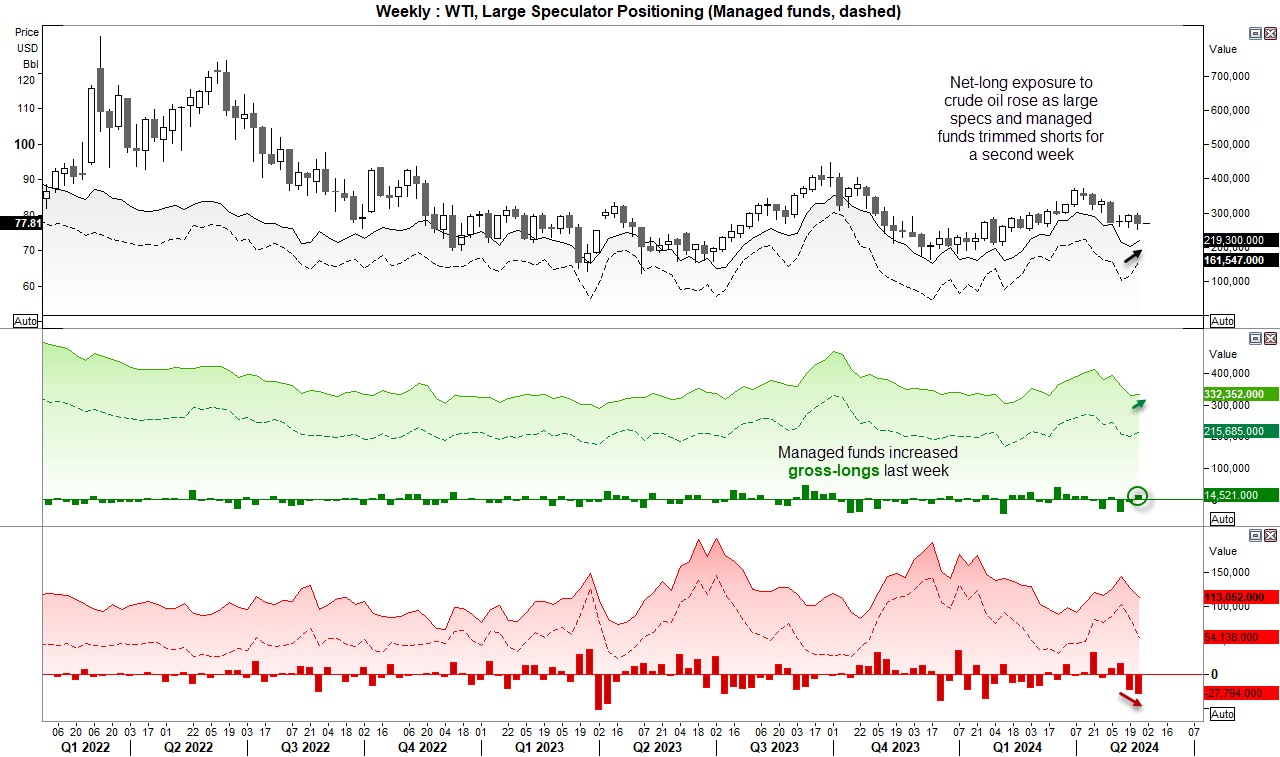
- Gross-short exposure to WTI crude oil by -11.2% (-14.3k contracts)
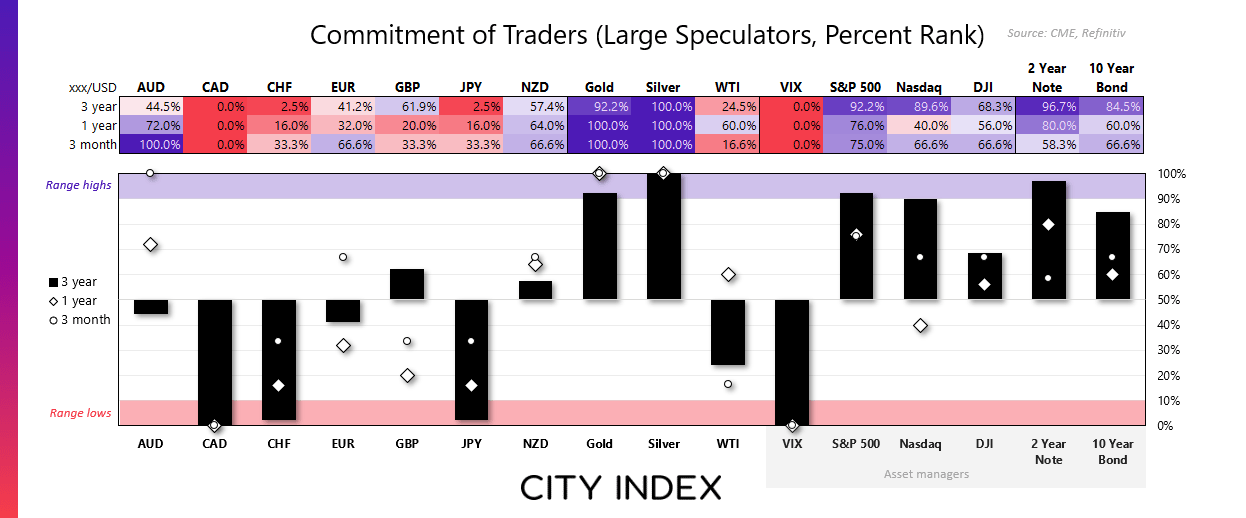
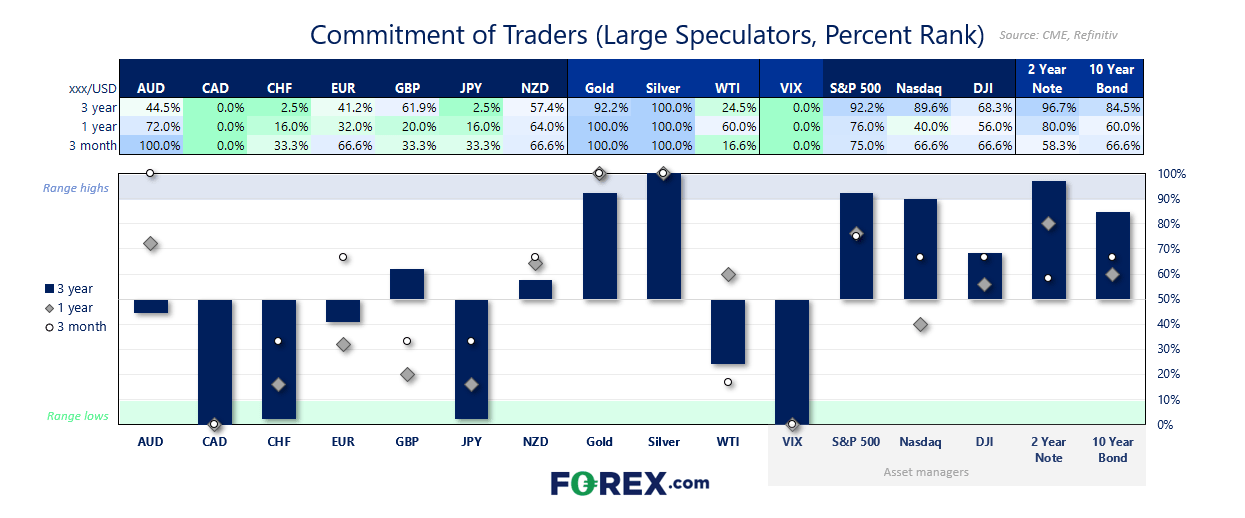
VIX (Volatility Index) futures positioning – COT report:
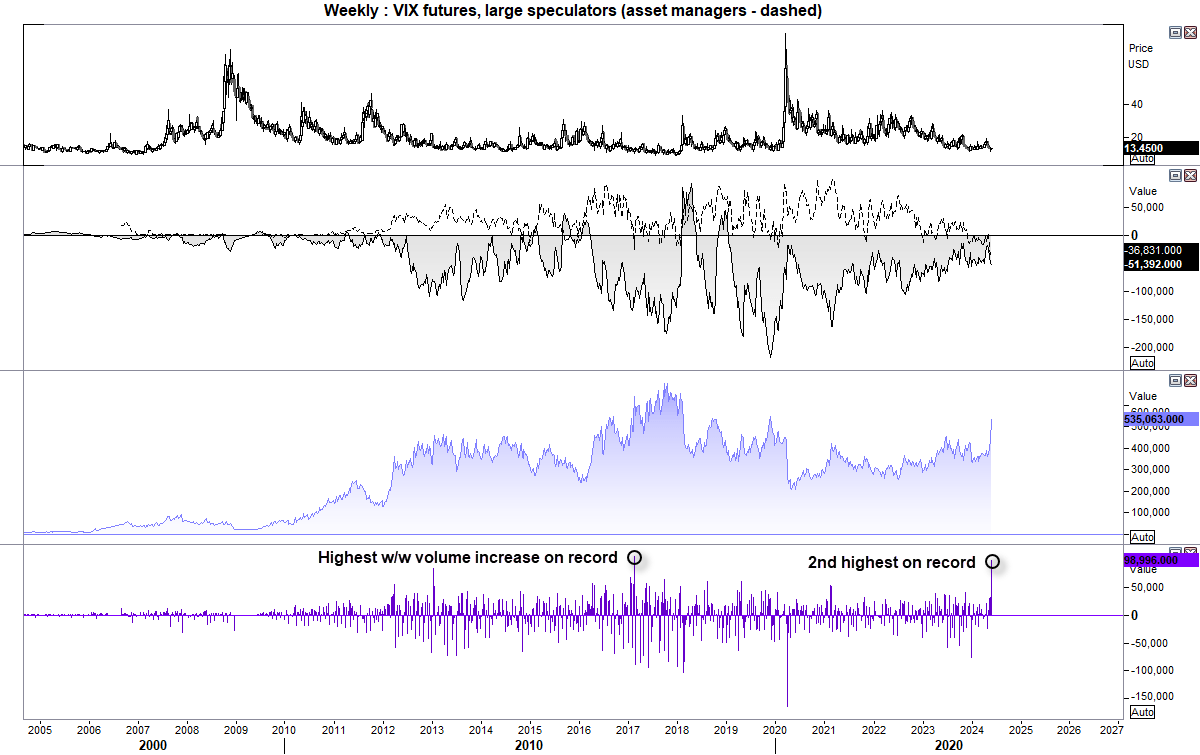
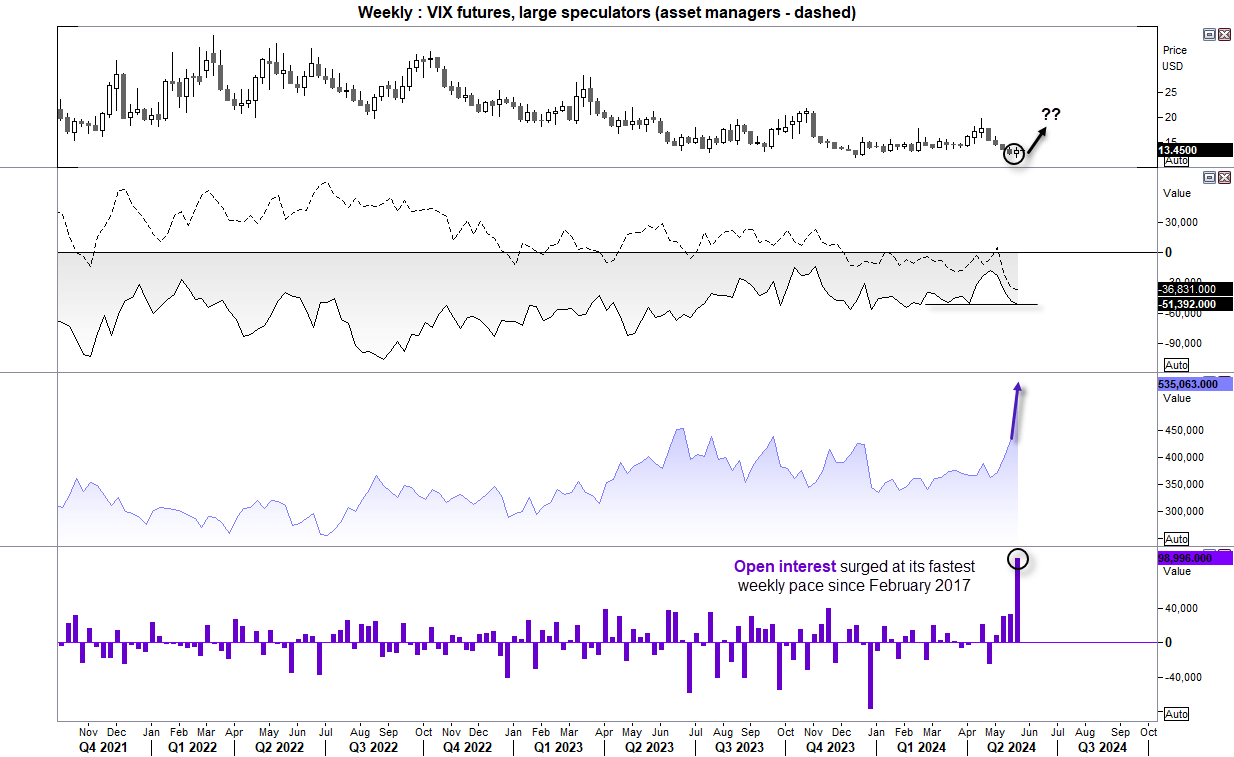
Open interest for VIX futures rose at its fastest weekly pace since Feb 2017 last week, making it the 2nd highest volume read on record. This is for all futures traded (not just speculators), but it does show vey high trading activity on VIX futures as it reached a four-year low last week.
Also take note that this data is only up to Tuesday 21st May, so it does not capture the response of Wall Street falling from its record highs. But as the VIX went on to break a 4-week bearish sequence, my hunch is that we’ve seen the cycle low for VIX for some time. And it may be best to buckle up.
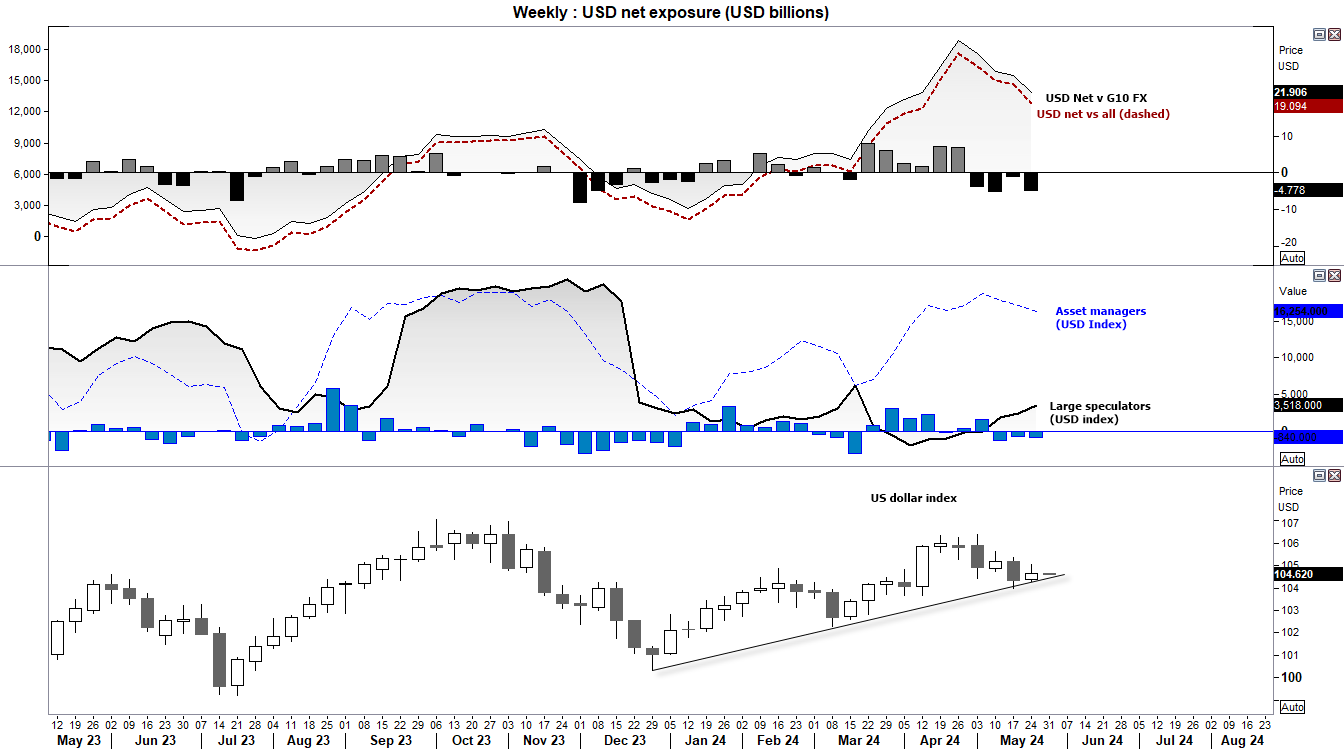
US dollar positioning (IMM data) – COT report:
Futures traders reduced net-long exposure to the US dollar for a fourth week according to the IMM, at a rate of -$4.8 billion last week. Asset managers also trimmed longs for a third week, and whilst large speculators increased net-long exposure it was because shorts were trimmed at a faster pace than longs.
We may find that positioning may not have changed much since, given the US dollar index rose to 105 before handing back most of the week’s gains on Friday. And with the US on public holiday and a PCE inflation report scheduled on Friday with month-end flows in between, we may find price action to be fickle and at times seemingly detached from drivers.
EUR/USD (European dollar futures) positioning – COT report:
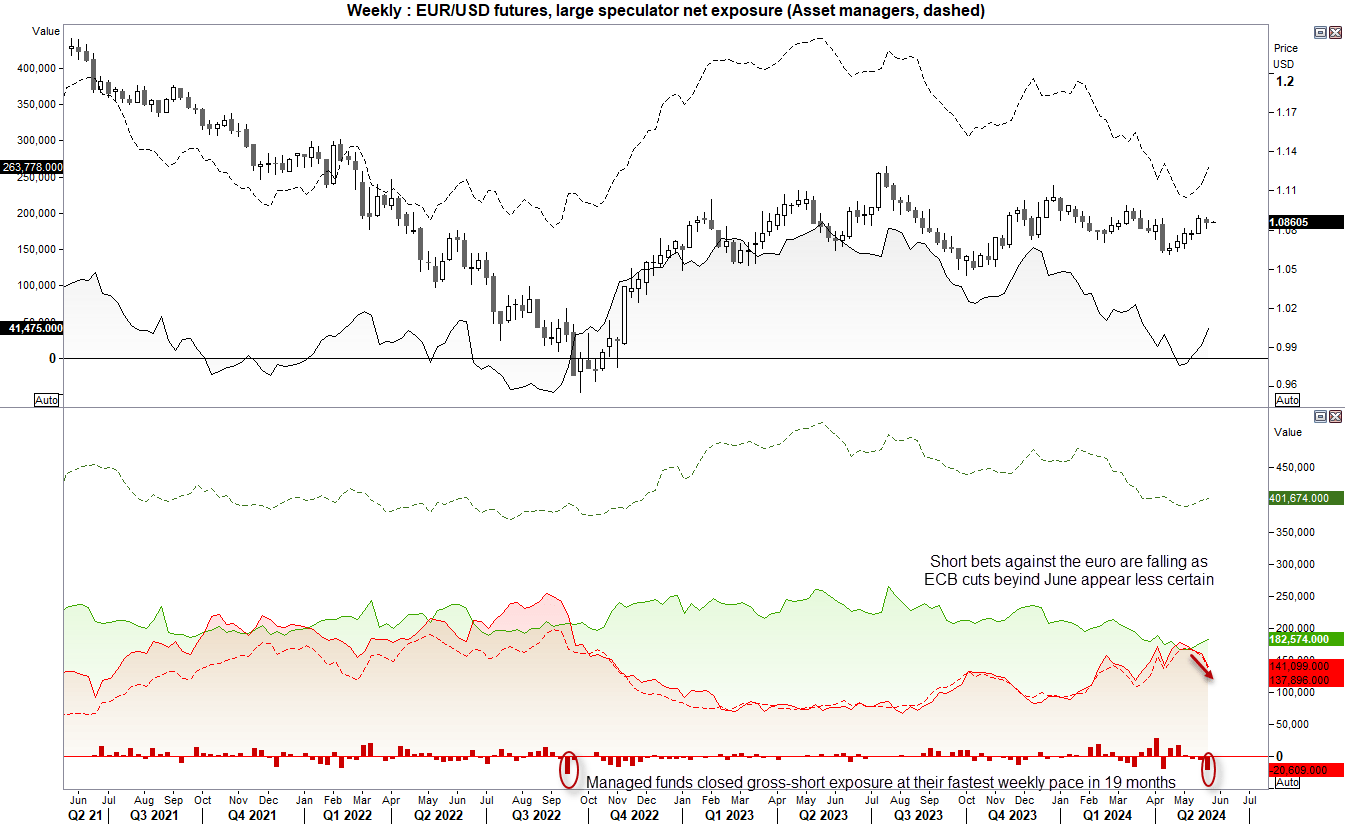
With ECB cuts beyond June now less certain, it has seen short bets against the euro to decline for a fourth week. Although the pace of shorts being closed was its fastest in 19 month among managed funds to show they are seriously reconsidering the ECB’s ability to cut more than once.
NZD/USD (New Zealand dollar futures) positioning – COT report:
Large speculators were on the cusp of flipping to net-long exposure to NZD/USD futures ahead of last week’s RBNZ meeting. And given the RBNZ surprised with a hawkish twist by revealing they had discussed raising interest rates (and not downgrading their OCR outlook as expected), I can only assume large specs flipped to net-long exposure by Wednesday’s close. Asset managers remain net short by -11k contracts compared with large speculators’ -1.4k contracts, yet the pattern among both sets of traders is clear as they’re both trimming shorts in exchange for fresh longs.
GBP/USD (British pound futures) positioning – COT report:
Like the euro, we’re seeing bears trim their shorts to GBP/USD futures whilst also increasing longs. Both the ECB and BOE claimed ‘Fed independence’, but that doesn’t mean much when data is pointing the wrong way for either central bank to cut more than once. And with large speculators marginally flipping to net-long exposure by last Tuesday’s close, I suspect we’ll see more bullish positioning in the next report given UK inflation data far exceeded expectations and now killed all hopes of a BOE cut in June.
WTI crude oil (CL) positioning – COT report:
The downside could be limited for WTI crude oil futures, if positioning is anything to go by. Gross-short exposure among large specs and managed managers fell for a second week, and managed funds increased long exposure last week.
But does that mean we can expect prices to simply rally? Not necessarily, unless a fresh catalyst arrives. And we have already seen crude oil’s reluctance to break above $80, with the 200-day average (and EMA) hovering around $80 to cap any rallies. So unless we’re dealt a bullish catalyst for oil prices alongside a softer US dollar, perhaps WTI crud oil is destined to remain within the $76 - $80 range for now.
Gold futures (GC) positioning – COT report:
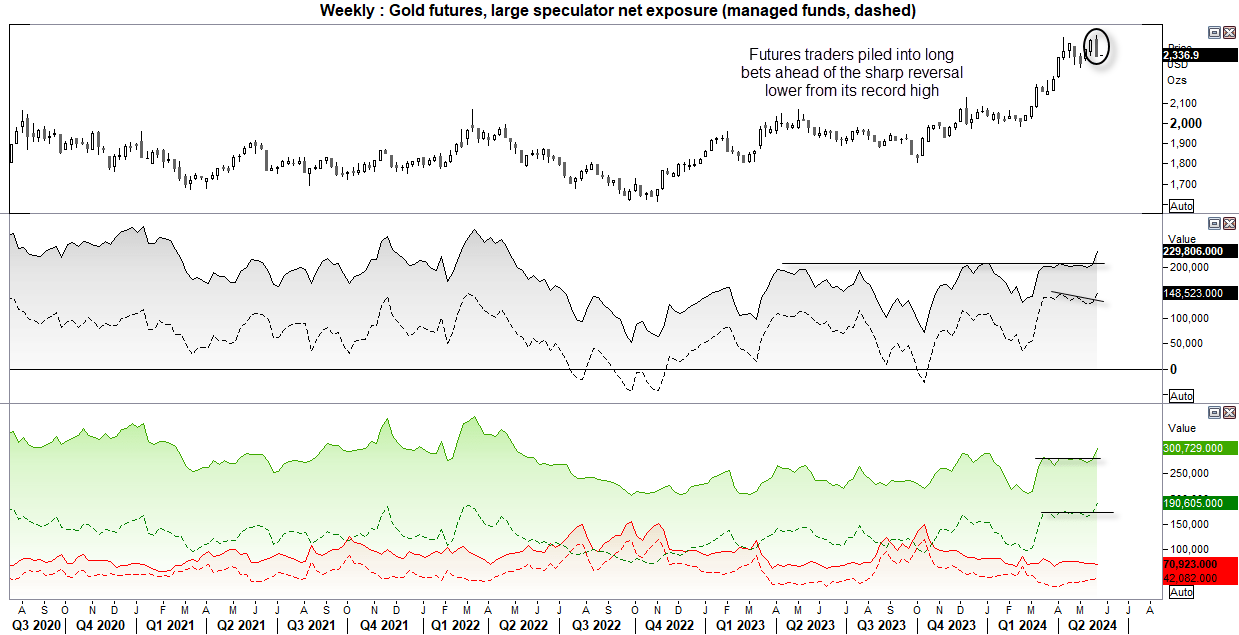
I noted on several occasions that net-long exposure to gold futures plateaued around levels that may be a historical extreme (by recent standards). Yet last week’s COT data shows that long waded in to the highs to push net-long exposure to the highest level since April 2022 among large speculators (or March 2022 for managed funds). And that seems to have been a mistake, and somewhat of a ‘last hurrah’ for bulls.
By Friday’s close, gold futures had confirmed a bearish engulfing candle on the weekly chart after a another failed attempt to break above $2400. I’m sure many of the bulls that waded in around the highs reversed their positions, so we may see a pickup of gross shorts in the next report. And with the prospects of another shooting star month forming for gold, and the potential of a higher US dollar thanks to the ‘higher for longer’ narrative of the Fed, gold might see some further downside before we can reconsider a new record high.
View Friday’s gold article for a technical breakdown:
Gold, Wall Street slammed as PMI data stifles hopes of Fed rate cuts
View Friday’s gold article for a technical breakdown:
Gold, Wall Street slammed as PMI data stifles hopes of Fed rate cuts
How to trade with City Index
You can easily trade with City Index by using these four easy steps:
- Open an account, or log in if you’re already a customer
• Open an account in the UK
• Open an account in Australia
• Open an account in Singapore
- Search for the company you want to trade in our award-winning platform
- Choose your position and size, and your stop and limit levels
- Place the trade
Related tags:
Latest market news




The complete CFD trading experience
Award-winning platforms, competitive spreads, low commissions and dedicated support.
We live and breathe the markets and are dedicated to helping traders realise their ambitions as we continue to set the industry bar.
Economic calendar
Web Trader platform
Our sophisticated web-based platform is packed with features.
Related articles
USD/CAD reversal risk builds as central bank showdown looms
USD/CAD has delivered a bullish reversal signal from established support, just as traders prepare for Fed and BoC decisions. Aggressive Canadian rate hike expectations and conflicting momentum signals make the coming session important.
EUR/USD weekly outlook: FOMC and ECB to set the tone
The current backdrop is modestly bearish. On Friday, the EUR/USD closed modestly lower, down for the third consecutive day. The pair also posted a weekly decline after staging a modest recovery attempt in the previous week. Out of the past 8 weeks, the EUR/USD has fallen on 6 occasions. There is not much supporting factors for the single currency right now. So, the upside remains capped.


USD/JPY Forecast: Is Rising Japanese Inflation Supporting the Yen?
As the trading week comes to an end, one of the most relevant developments in the FX market has been the renewed strength of the Japanese yen. This can be seen in the recent performance of USD/JPY, which has fallen nearly 1.0% over the last two trading sessions, highlighting a meaningful recovery in the Japanese currency against the U.S. dollar.

StoneX Europe Ltd may make third party material available on this website which may contain information included but not limited to the conditions of financial markets. The material is for information purposes only and does not contain, and should not be construed as containing, investment advice and/or investment recommendation and/or an investment research and/or an offer of or solicitation for any transactions in financial instruments; any decision to enter into a specific transaction shall be made by the client following an assessment by him/her of their situation.
StoneX Europe Ltd makes no representation or warranty and assumes no liability as to the accuracy or completeness of the information provided, nor any loss arising from any investment based on a recommendation, forecast or other information supplied. You should always seek independent advice as to your suitability to speculate in any related markets and your ability to assume the associated risks, if you are at all unsure. We are not under any obligation to update any such material. Any opinion made may be personal to the author and may not reflect the opinion of StoneX Europe Ltd.