



Silver Slide Tests Trendline Support, $60 Handle
Silver prices have been more than halved since the January high but last week saw a key trendline come into play as bulls grasp to hold the $60 handle for the metal.
Share this:

Silver Talking Points:
- The slide in silver has continued and the metal is currently down by more than 50% from the January high.
- It took 14 years for Silver to take out the $50 level after coming less than 20 cents away from that price back in 2011.
The pent up breakout hit with a fury last year as breakout at $50 led to a move that more than doubled over the next few months. Silver had a full head of steam into the 2026 open and in short order the metal was already testing above the $120/oz level. But what started as a pullback soon turned into a reversal, helped along by the fear of inflation from higher oil prices in March.
Since then it’s been about as non-ideal of a backdrop as possible for the long side of metals, as higher inflation has driven more-hawkish policy, while US Treasury yields have jumped to fresh decade or multi-decade highs along the curve. And while the pullback has been sizable in metals, what is perhaps more notable is how well support has come into play. With gold, it was the fight at the $4k handle. In Silver, it’s been the $60 level so far and perhaps most notable is the fact that the $50 level hasn’t even come into play as support with buyers stepping in ahead of a test there.
Silver Weekly Chart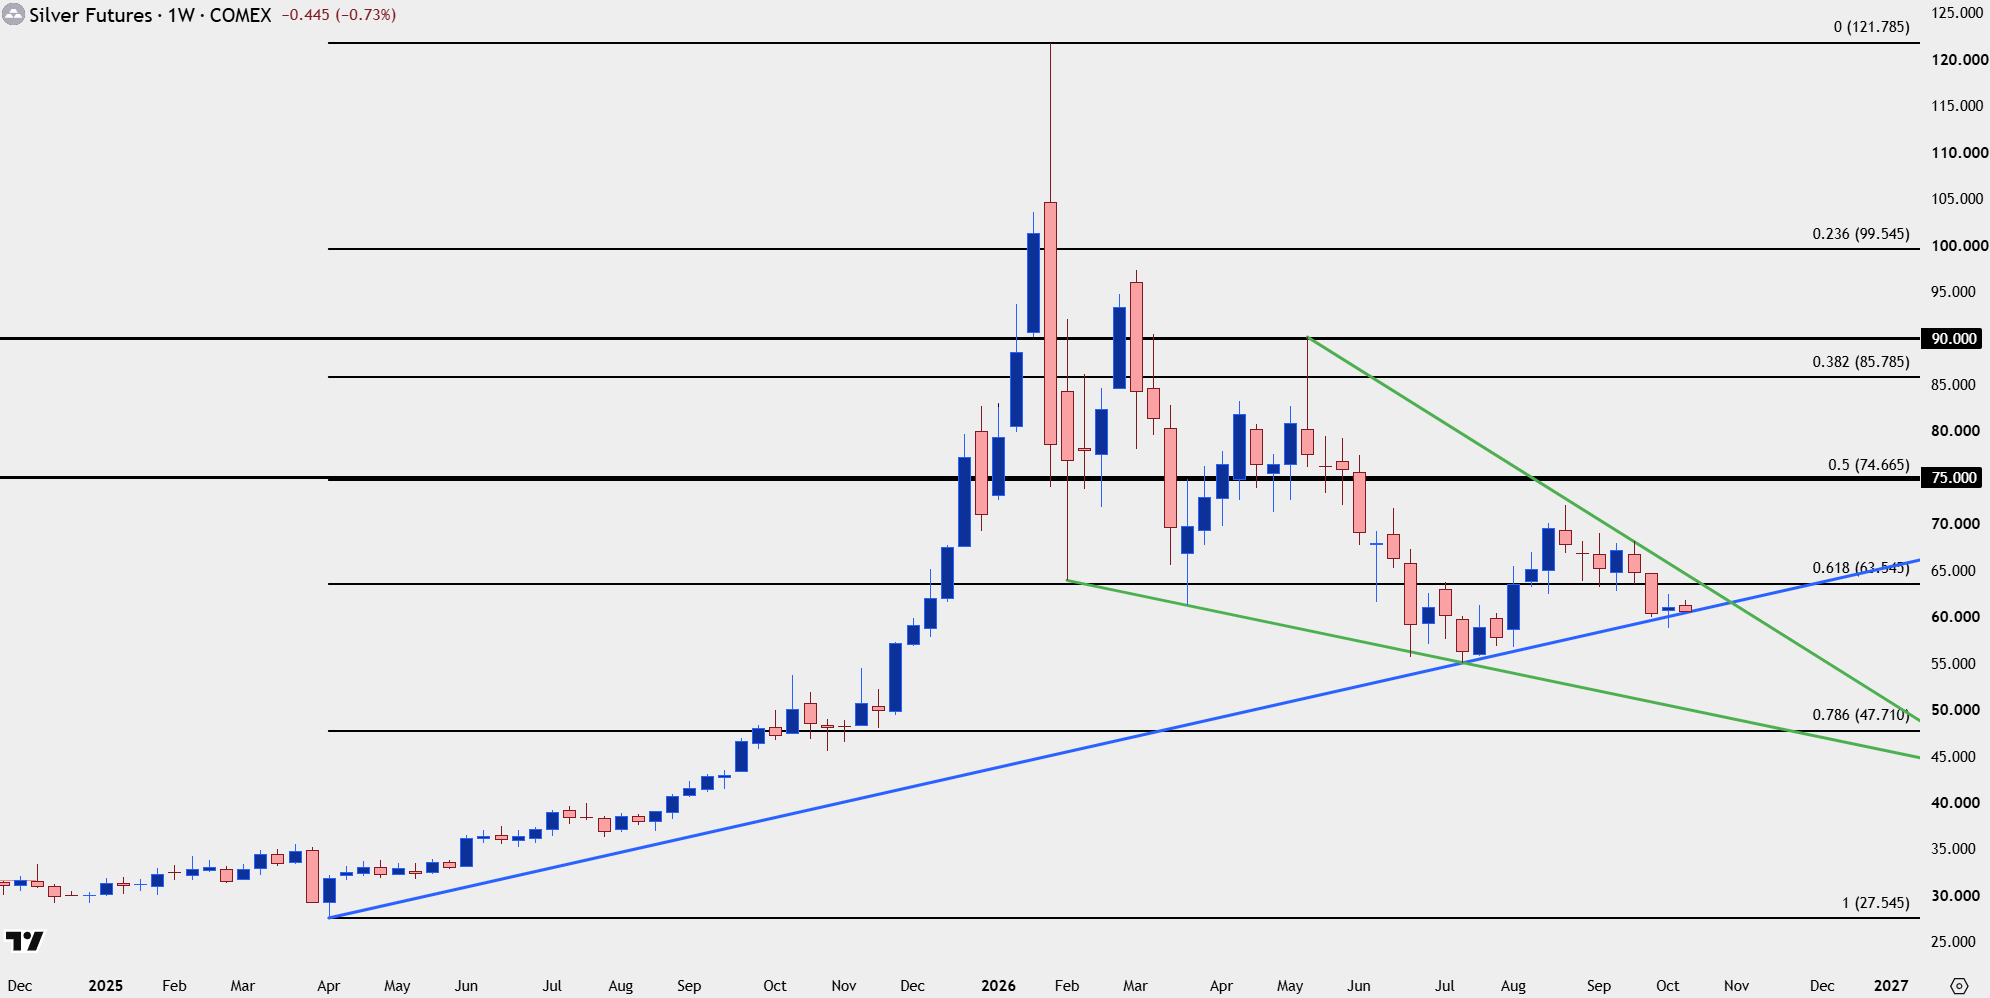
Chart prepared by James Stanley; data derived from Tradingview
Silver Structure
Last week saw a single daily close below the $60 level in Silver, and so far that’s produced a bounce, but from the daily chart below, structure is still bearish as that poke below the big figure was a lower-low and that goes with a prior lower-high. This does a couple of things as it helps to provide existing structure but it also shows what bulls need to beat if they want to re-take control, and the prior swing of support-turned-resistance at 62.45 stands out as the level that buyers need to push through to produce a higher-high.
And for higher-low support, the $60 level stands out as a potentially big spot, with 59.23 below that and then the current low of 58.73 marking invalidation for bullish scenarios.
Silver Daily Chart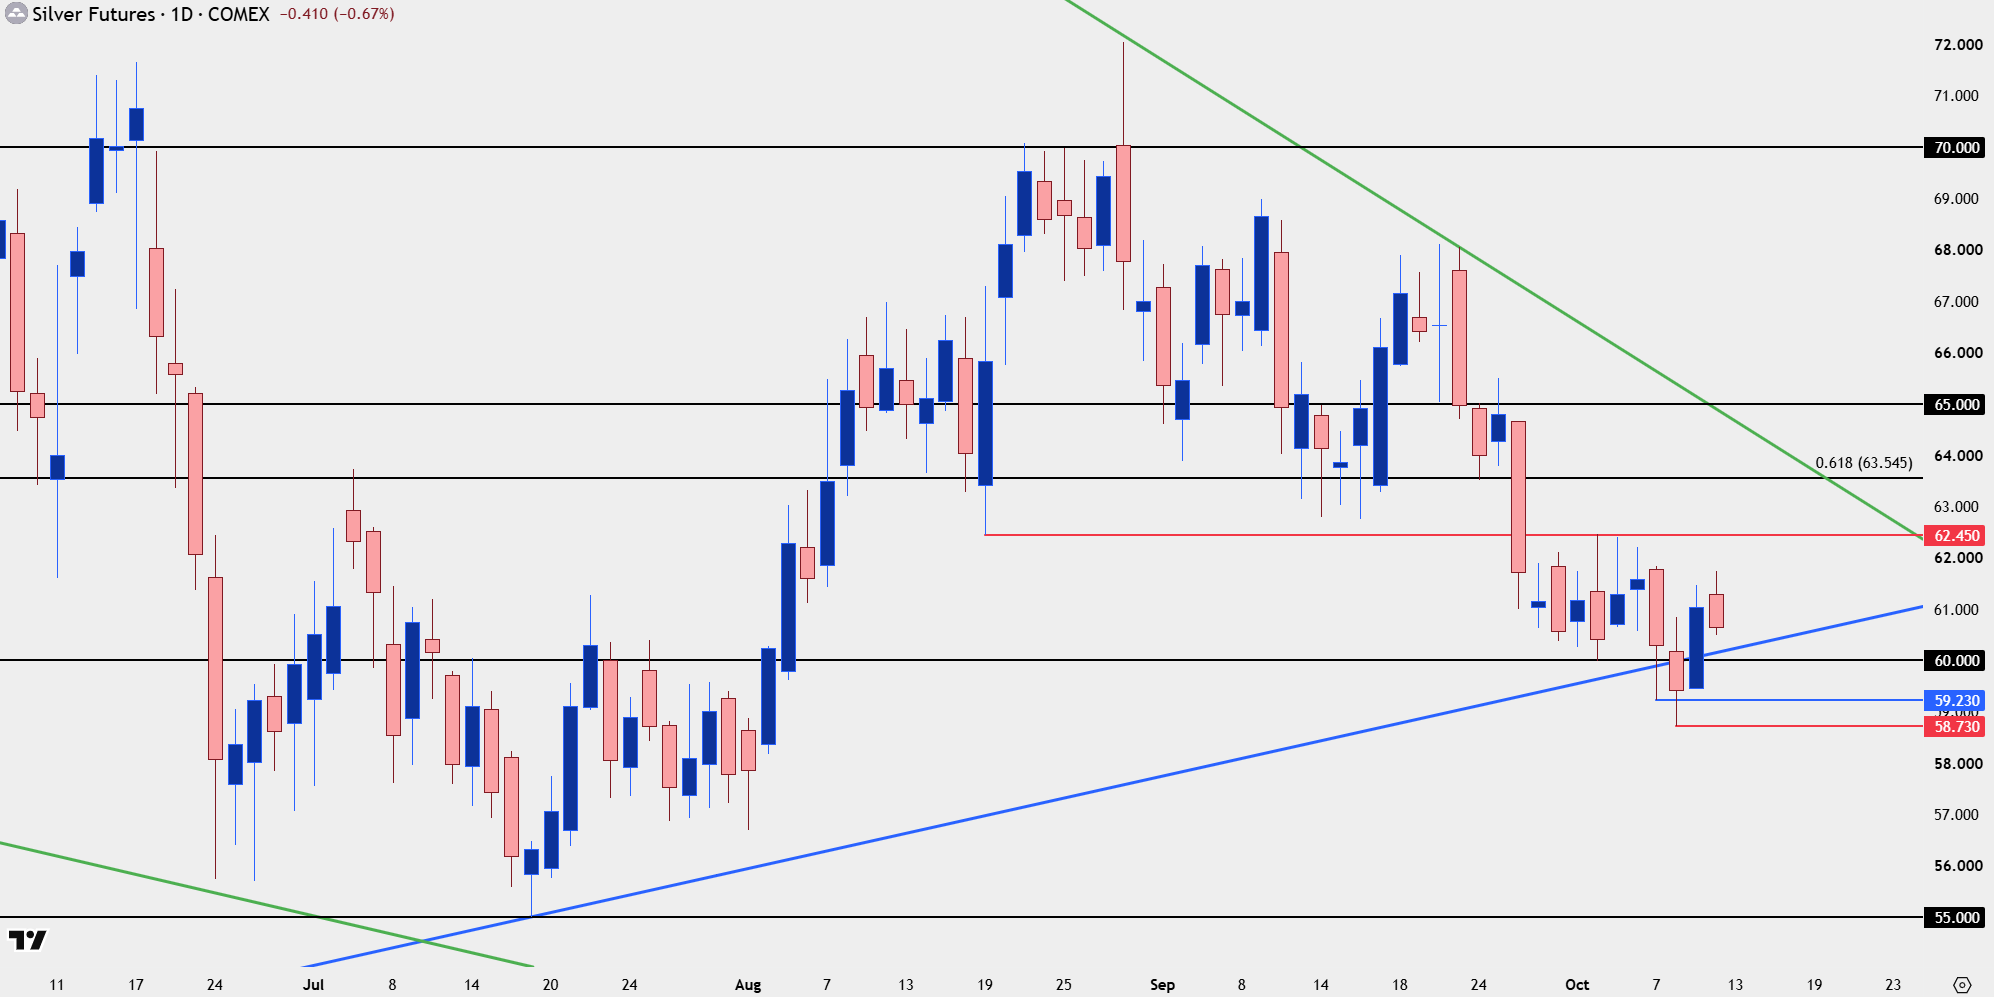
Chart prepared by James Stanley; data derived from Tradingview
--- written by James Stanley, Senior Market Analyst, Global Macro
Related tags:



The complete CFD trading experience
Award-winning platforms, competitive spreads, low commissions and dedicated support.
We live and breathe the markets and are dedicated to helping traders realise their ambitions as we continue to set the industry bar.
Economic calendar
Web Trader platform
Our sophisticated web-based platform is packed with features.
Related articles
Silver Slide Tests Trendline Support, $60 Handle
Silver prices have been more than halved since the January high but last week saw a key trendline come into play as bulls grasp to hold the $60 handle for the metal.

Euro Weekly Forecast: EUR/USD Dawdles At Lows Despite Daily RSI Oversold
Despite a deep oversold read bulls didn’t exactly come screaming back into the EUR/USD market, although a series of higher-lows may be an early warning that a turning point may be near.

US Dollar Price Action Setups: EUR/USD, USD/JPY, GBP/USD, USD/CAD
The US Dollar remained strong last week even as EUR/USD started to show a series of higher-lows. USD/JPY continues to be bought on dips as the fundamental deviation between the two economies remains front-and-center.
StoneX Europe Ltd may make third party material available on this website which may contain information included but not limited to the conditions of financial markets. The material is for information purposes only and does not contain, and should not be construed as containing, investment advice and/or investment recommendation and/or an investment research and/or an offer of or solicitation for any transactions in financial instruments; any decision to enter into a specific transaction shall be made by the client following an assessment by him/her of their situation.
StoneX Europe Ltd makes no representation or warranty and assumes no liability as to the accuracy or completeness of the information provided, nor any loss arising from any investment based on a recommendation, forecast or other information supplied. You should always seek independent advice as to your suitability to speculate in any related markets and your ability to assume the associated risks, if you are at all unsure. We are not under any obligation to update any such material. Any opinion made may be personal to the author and may not reflect the opinion of StoneX Europe Ltd.