



S&P 500 Forecast: SPX pulls back from the 7,000 level ahead of inflation data
As the week draws to a close, the SPX index has so far failed to maintain a confident short-term outlook. In the current session, the index is down more than 1%, reinforcing a more consistent weakening scenario as markets await the release of annual U.S. inflation.
Share this:

As the week draws to a close, the SPX index has so far failed to maintain a confident short-term outlook. In the current session, the index is down more than 1%, reinforcing a more consistent weakening scenario as markets await the release of annual U.S. inflation (CPI) data tomorrow and assess how it could impact expectations for future Federal Reserve decisions.
Additionally, long-term confidence indicators have lacked stability, contributing to the persistent weakness seen in recent price action. Once markets digest the upcoming economic data, a clearer directional move could begin to take shape in the coming sessions.

The market awaits CPI data
Annual U.S. CPI data will be released tomorrow. Current forecasts point to inflation at 2.5%, down from the previous 2.7% reading. However, markets are not fully convinced that a sustained slowdown in price pressures is underway. This skepticism stems partly from the recent upside surprise in employment data (NFP), as well as the absence of a clear deceleration in inflation readings for November and December 2025, which have yet to show convincing convergence toward the Federal Reserve’s 2.00% target.

Source: TradingEconomics
This context is important because, following the employment data release, the probability of the Federal Reserve holding rates at 3.75% rose above 93%, compared to roughly 70% just one month ago. This shift suggests that the strong labor market performance has led markets to adjust expectations, anticipating a firmer stance from the Fed in the near term.
Under this scenario, if inflation fails to show clear signs of cooling, it could reinforce expectations that interest rates will remain elevated for longer in order to contain price pressures.
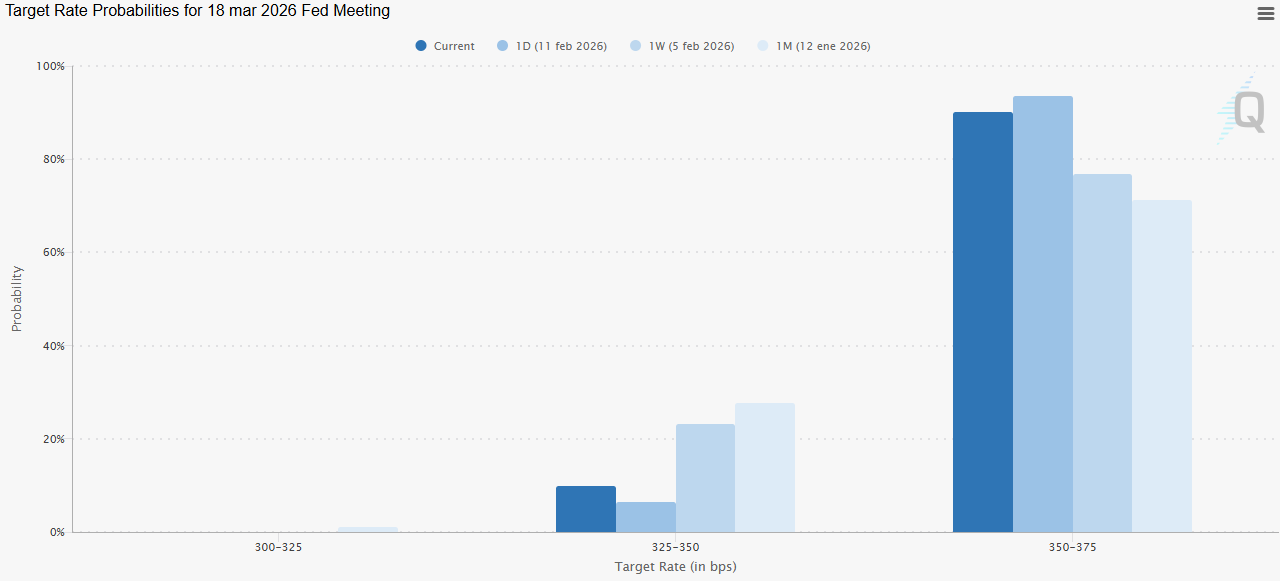
Source: CMEGROUP
In this environment, expectations surrounding economic data are weighing on equity market confidence. A scenario in which employment strengthens but inflation does not ease convincingly reduces the likelihood of rapid rate cuts. This implies higher borrowing costs for longer, slower consumer momentum, and potential pressure on corporate growth—factors that ultimately reduce the appeal of instruments such as the SPX.
Thus, the index’s recent weakness reflects market indecision ahead of the inflation release and uncertainty about the path of prices in the coming months. If the data surprise to the upside, expectations of higher rates for longer could strengthen, weighing on equity appetite. Conversely, a clear and sustained slowdown in inflation could help restore confidence in the short term.
Long-term confidence remains in sensitive territory
Beyond short-term economic expectations, long-term sentiment in the equity market remains uncertain. According to the AAII Investor Sentiment Survey, the six-month outlook shows 38.5% bullish, 23.3% neutral, and 38.1% bearish, highlighting the absence of a dominant directional bias in market expectations.
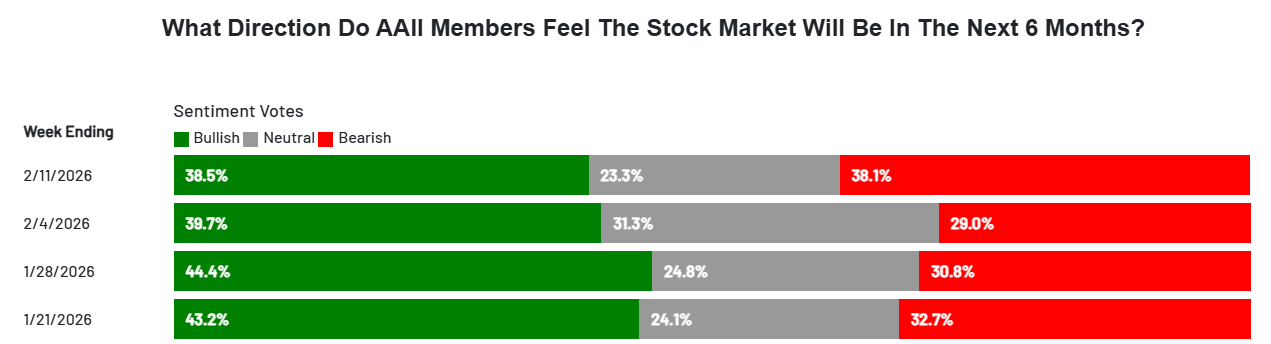
Source: AAII
If the AAII confidence index fails to show sustained improvement in the coming weeks, this could limit the stability of long-term demand for indices such as the SPX. As a result, structural confidence may become an additional factor preventing a consistent recovery in buying pressure.
S&P 500 technical Outlook
Source: StoneX, Tradingview
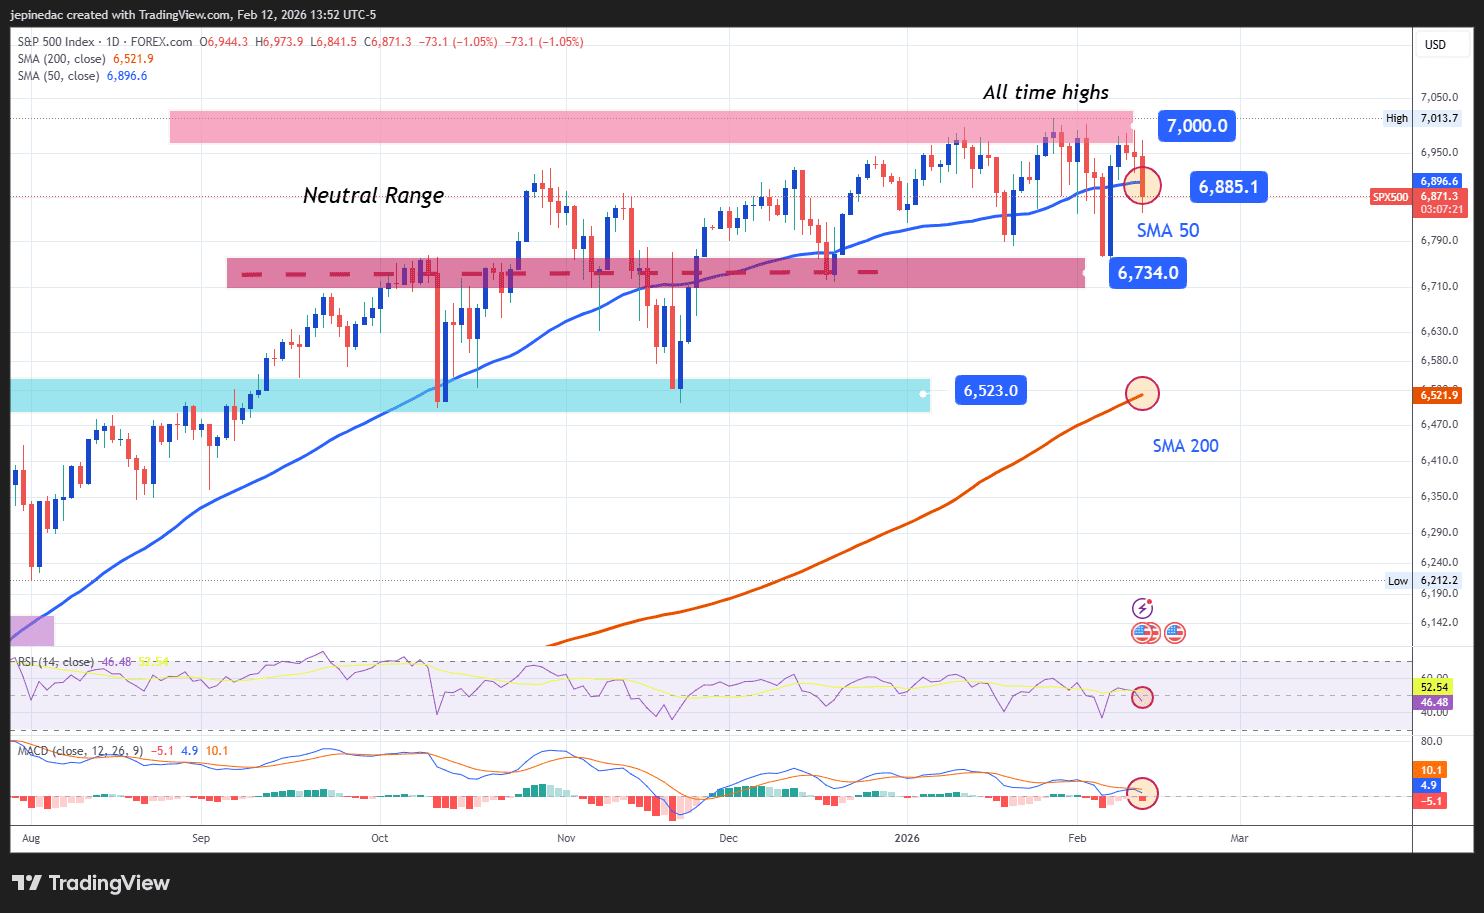
- Dominant sideways range: Since November 2025, the SPX has maintained a sideways structure, fluctuating between resistance near 7,000 points and support around 6,700 points. So far, neither bullish nor bearish momentum has been strong enough to break this range, which remains the most relevant technical formation. As long as this structure holds, the emergence of a more dominant directional trend could remain limited.
- RSI: The RSI line remains near the neutral 50 level, indicating that bullish and bearish momentum over the past 14 sessions is balanced. This behavior reflects ongoing indecision in recent SPX price action.
- MACD: A similar scenario is visible in the MACD, where the histogram remains close to the zero line, suggesting that short-term moving average momentum is neutral. This reinforces the perception of near-term indecision.
Key levels:
- 7,000 points – Key resistance: A level aligned with historical highs and representing an important psychological barrier. A sustained break above this area could reactivate a stronger bullish bias.
- 6,885 points – Near-term barrier: A neutrality zone aligned with the 50-period simple moving average. Prolonged price action around this level could maintain the current sideways range.
- 6,734 points – Key support: The level defining the floor of the current trading range. Sustained declines below this zone could trigger more dominant selling pressure in the coming weeks.
Written by Julian Pineda, CFA, CMT – Market Analyst
Follow him on: @julianpineda25
Related tags:
Latest market news




The complete CFD trading experience
Award-winning platforms, competitive spreads, low commissions and dedicated support.
We live and breathe the markets and are dedicated to helping traders realise their ambitions as we continue to set the industry bar.
Economic calendar
Web Trader platform
Our sophisticated web-based platform is packed with features.
Related articles

S&P 500 forecast: Stocks extend drop as correction risks grow
US and global equity markets have extended Wednesday’s sell-off, with Wall Street opening lower after a weak handover from Asia and Europe. The deterioration in risk appetite has been spreading across global markets. The dollar was firmer, Treasury yields were holding onto yesterday’s gains, while gold, silver and bitcoin were all under pressure alongside equities and major currencies.


Nikkei threatens breakout as tech rebound broadens
Breakouts across the SOX and Nasdaq are being matched by rebounds across Asia, with the Nikkei now threatening to join the move.

Nasdaq 100 Forecast: Confidence Returns as the Index Challenges Record Highs
The trading week is getting underway with renewed bullish momentum across Nasdaq. This is reflected in today's session, where the index has gained more than 2.5%, highlighting a buying bias that has not been observed with this level of strength in several weeks.
StoneX Europe Ltd may make third party material available on this website which may contain information included but not limited to the conditions of financial markets. The material is for information purposes only and does not contain, and should not be construed as containing, investment advice and/or investment recommendation and/or an investment research and/or an offer of or solicitation for any transactions in financial instruments; any decision to enter into a specific transaction shall be made by the client following an assessment by him/her of their situation.
StoneX Europe Ltd makes no representation or warranty and assumes no liability as to the accuracy or completeness of the information provided, nor any loss arising from any investment based on a recommendation, forecast or other information supplied. You should always seek independent advice as to your suitability to speculate in any related markets and your ability to assume the associated risks, if you are at all unsure. We are not under any obligation to update any such material. Any opinion made may be personal to the author and may not reflect the opinion of StoneX Europe Ltd.