




Stocks not Worried about US Iran Conflict
Make sure to keep an eye on the VIX to see if this type of price action continues.
Share this:

The US and Iran traded barbs this weekend heating things up after the US attack on an Iranian military official last week. S&Ps gapped open lower on the reopen after the weekend and naturally traded off due to fears of an Iranian retaliation from Friday’s close at 3235.5 down to 3220.25. S&Ps managed to trade as low as 3208.75, barely holding Friday’s lows of 3206.75. However, when the US session began at 9:30am, it was risk-on and the overnight gap was filled!
Source: Tradingview, CME, FOREX.com
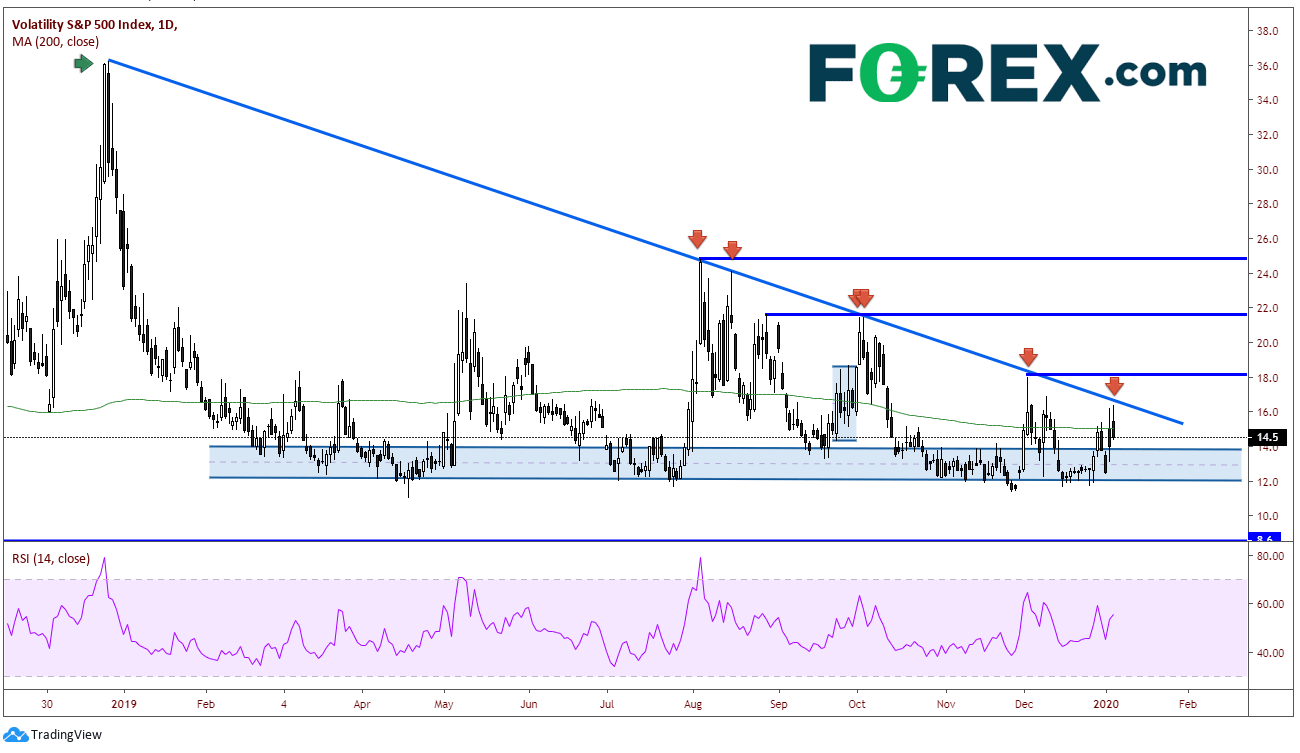
The Volatility S&P 500 Index, more commonly known as the VIX, is an index of the market’s expectations for volatility over the next 30 days. Traditionally, the VIX trades inversely to stocks; so, if stocks trade higher, the VIX tends to trade lower. The VIX has been moving lower since December 26th, 2018, when the stock market began its impressive rally off the lows. Notice that every time over the last year when the price action tried to push higher through the downward sloping trendline, it was rejected and pushed back down towards the 12.0-14.0 level. Price is currently trading near the 200 Day Moving Average is near 15.0.
Source: Tradingview, FOREX.com
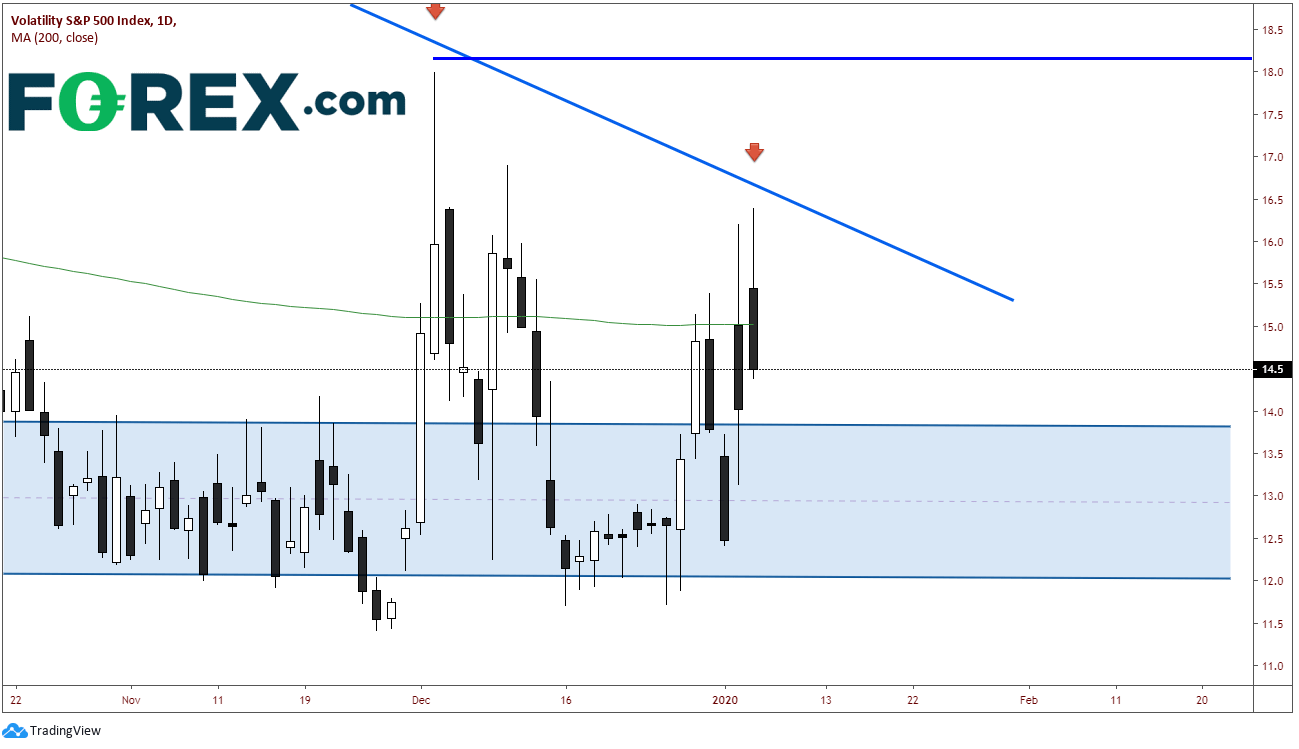
Notice on the candlesticks over the last 4 days how the VIX has spiked higher at some point during the day and closed lower (although todays session still has a few hours left).
Source: Tradingview, FOREX.com
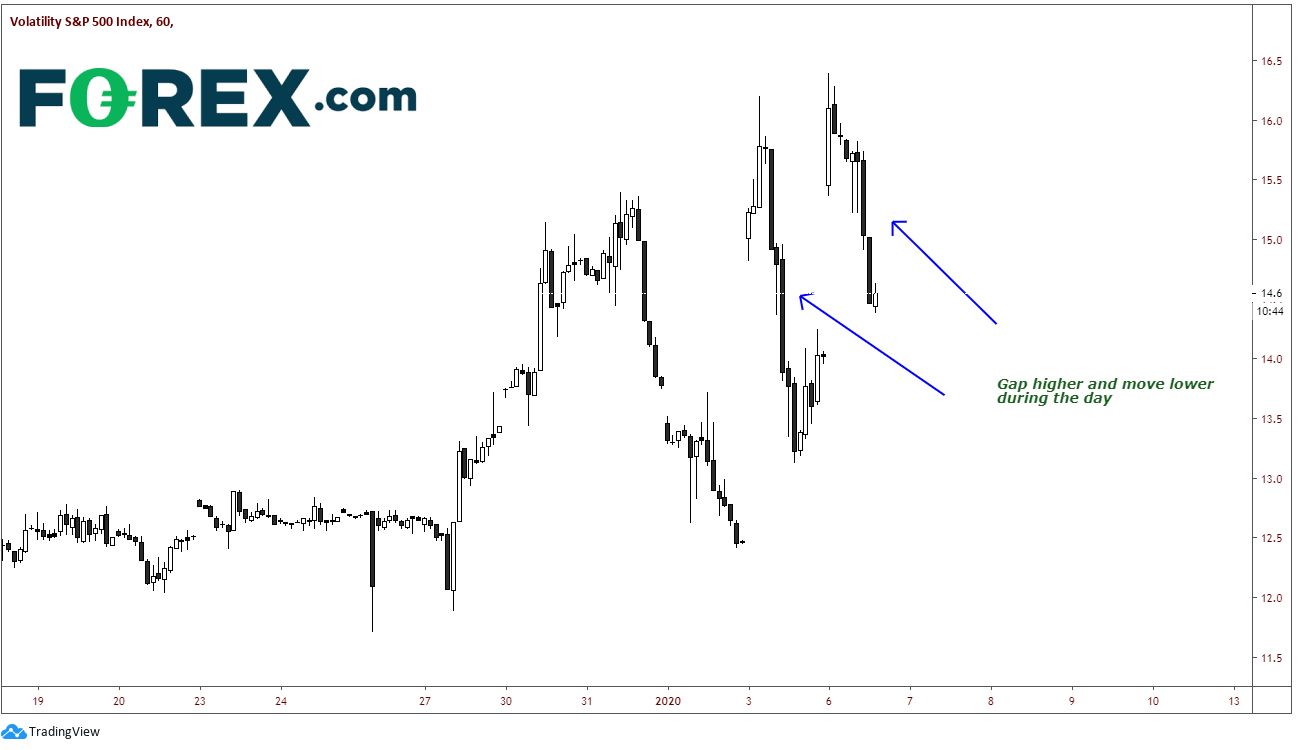
Unlike most financial instruments these days, the VIX does not trade overnight, so there tends to be frequent gaps in the market between the close the next day’s open. On a 60-minute chart, notice how price gapped open the Friday morning US session (after the attacks) as fear set in, and slowly traded off during the rest of the session. So far today, we see the same type of price action: Price gapped higher after the weekend on fears of retaliation from Iran, and slowly traded off throughout the day (as stocks bounced and filled the gap).
Source: Tradingview, FOREX.com
Make sure to keep an eye on the VIX if you are trading stock indices and see if this type of price action continues. If price trades higher and breaks above 16.0, or the long-term trendline, stocks may head lower. However, if the VIX trades lower and breaks 12.0, stocks could run much higher.
Related tags:
Latest market news




The complete CFD trading experience
Award-winning platforms, competitive spreads, low commissions and dedicated support.
We live and breathe the markets and are dedicated to helping traders realise their ambitions as we continue to set the industry bar.
Economic calendar
Web Trader platform
Our sophisticated web-based platform is packed with features.
Related articles
USD/MXN Analysis: Is Super Peso Starting to Fade?
Over recent trading sessions, the Mexican peso has continued to show signs of weakness against the U.S. dollar. This can already be seen in USD/MXN, which has gained more than 1.7% over the last three sessions, highlighting sustained buying pressure in favor of the dollar in the short term.
Canadian Dollar Analysis: USD/CAD Returns to July Highs Ahead of NFP
The Canadian dollar continues to face one of its most challenging environments in recent months when it comes to maintaining strength against the U.S. dollar. The weakness of the Canadian currency is clearly reflected in USD/CAD, which has now recorded nine consecutive bullish sessions and gained more than 1.7% during that period.

US Dollar Technical Outlook: DXY Bulls Meet Resistance at Yearly Highs 10 1 2026
The U.S. Dollar has held firm despite fading Fed hike bets, but Friday’s payrolls could test the rally’s staying power.

StoneX Europe Ltd may make third party material available on this website which may contain information included but not limited to the conditions of financial markets. The material is for information purposes only and does not contain, and should not be construed as containing, investment advice and/or investment recommendation and/or an investment research and/or an offer of or solicitation for any transactions in financial instruments; any decision to enter into a specific transaction shall be made by the client following an assessment by him/her of their situation.
StoneX Europe Ltd makes no representation or warranty and assumes no liability as to the accuracy or completeness of the information provided, nor any loss arising from any investment based on a recommendation, forecast or other information supplied. You should always seek independent advice as to your suitability to speculate in any related markets and your ability to assume the associated risks, if you are at all unsure. We are not under any obligation to update any such material. Any opinion made may be personal to the author and may not reflect the opinion of StoneX Europe Ltd.