


Swiss Franc Technical Outlook: USD/CHF Bulls Attempt to Regroup After Sharp Reversal
USD/CHF is attempting to rebound after a sharp reversal, with former support now posing the first major test for the recovery.
Share this:

Swiss Franc Technical Outlook: USD/CHF Multi-Timeframe Analysis
The USD/CHF technical outlook shows a six-week rally stalling at long-term resistance as U.S. Treasury yields keep climbing. Michael Boutros, StoneX Media Senior Market Analyst, breaks down USD/CHF across three timeframes and the bond market backdrop. The broader USD/CHF uptrend from the yearly lows remains intact, while an outside daily reversal signals near-term pullback risk. U.S. Treasury yields keep rising even as Fed funds futures price in a Federal Reserve hold, reflecting concern about inflation and the U.S. fiscal situation. FOMC minutes and University of Michigan sentiment data headline the U.S. calendar.
This content was created by an affiliate of FOREX.com and represents the views and opinions of the author/speakers, not the views and opinions of Forex.com, StoneX Group Inc., or its subsidiaries. The content has not been independently reviewed by FOREX.com.

USD/CHF Economic Data Release
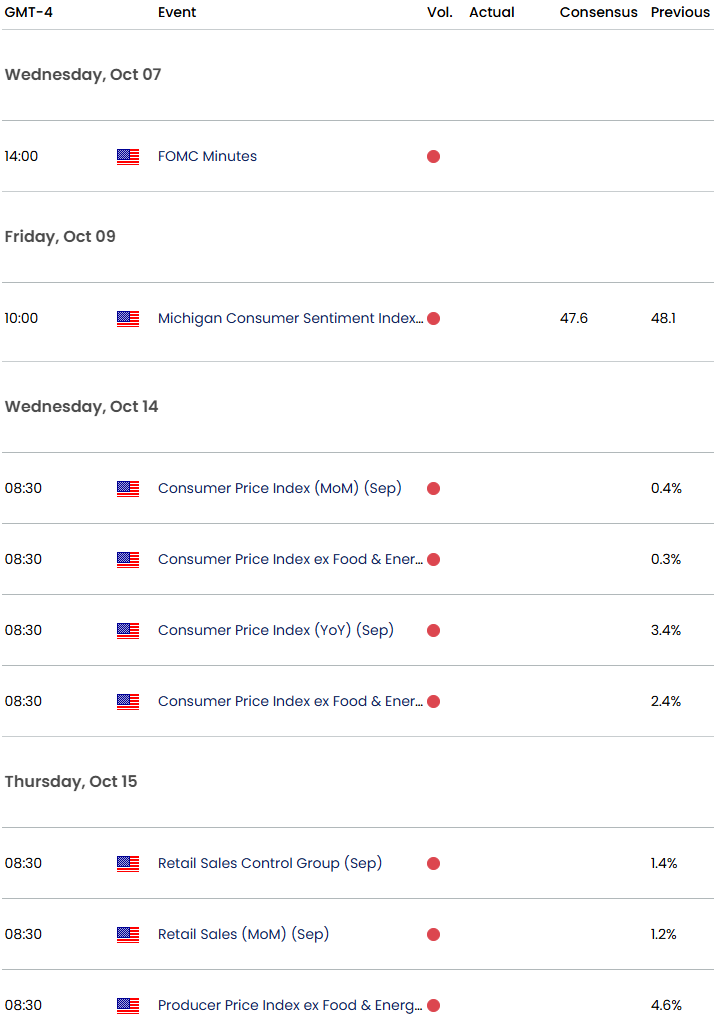
Economic Calendar - latest economic developments and upcoming event risk.
Active Short-term Technical Video Updates
- US Dollar Technical Outlook: DXY Bulls Meet Resistance at Yearly Highs
- British Pound Technical Outlook: GBP/USD Rebound Challenges September Downtrend
- Canadian Dollar Technical Outlook: USD/CAD Seven-Day Rally Tests Major Resistance
- Australian Dollar Technical Outlook: AUD/USD Breakdown Threatens Deeper Correction
--- Written by Michael Boutros, Senior Technical Strategist
Follow Michael on X @MBForex



The complete CFD trading experience
Award-winning platforms, competitive spreads, low commissions and dedicated support.
We live and breathe the markets and are dedicated to helping traders realise their ambitions as we continue to set the industry bar.
Economic calendar
Web Trader platform
Our sophisticated web-based platform is packed with features.
Related articles
Swiss Franc Technical Outlook: USD/CHF Bulls Attempt to Regroup After Sharp Reversal 10 6 2026
USD/CHF is attempting to rebound after a sharp reversal, with former support now posing the first major test for the recovery.

DAX Recovery Tested at Key 25,500 Resistance Zone
The DAX has recovered sharply from its September correction, climbing back above 25,000 after successfully holding long-term support near the 200-day moving average. While the broader bull trend remains intact, the index is now approaching one of the most important technical resistance zones on the chart. A break above 25,500–25,600 would strengthen the bullish case and open the door toward 26,000 and eventually the August record high. Failure at this level would suggest the recent move remains a corrective rebound rather than the start of a new leg higher.


USD Majors Test Critical Levels Post-NFP | Weekly Technical Outlook 10 5 2026
Sr. Technical Strategist Michael Boutros highlights the levels that matter on the USD Majors, commodities, and equity indices charts this week.
StoneX Europe Ltd may make third party material available on this website which may contain information included but not limited to the conditions of financial markets. The material is for information purposes only and does not contain, and should not be construed as containing, investment advice and/or investment recommendation and/or an investment research and/or an offer of or solicitation for any transactions in financial instruments; any decision to enter into a specific transaction shall be made by the client following an assessment by him/her of their situation.
StoneX Europe Ltd makes no representation or warranty and assumes no liability as to the accuracy or completeness of the information provided, nor any loss arising from any investment based on a recommendation, forecast or other information supplied. You should always seek independent advice as to your suitability to speculate in any related markets and your ability to assume the associated risks, if you are at all unsure. We are not under any obligation to update any such material. Any opinion made may be personal to the author and may not reflect the opinion of StoneX Europe Ltd.