





US Dollar Forecast: USD/JPY Gives Back Post-US Election Rally
USD/JPY trades to a fresh monthly low (150.46) as it gives back the advance following the US election.
Share this:

US Dollar Outlook: USD/JPY
USD/JPY trades to a fresh monthly low (150.46) as it gives back the advance following the US election, and the exchange rate may fall towards the October low (142.97) as it carves a series of lower highs and lows.
US Dollar Forecast: USD/JPY Gives Back Post-US Election Rally
Keep in mind, the decline from the monthly high (156.75) kept the Relative Strength Index (RSI) out of overbought territory, and a further depreciation in the exchange rate may continue to curb the threat of a currency intervention as the Bank of Japan (BoJ) pledges to support the economy.
Join David Song for the Weekly Fundamental Market Outlook webinar.
David provides a market overview and takes questions in real-time. Register Here
Meanwhile, the Federal Reserve appears to be on track to further unwind its restrictive policy as the minutes from the November meeting reveals that ‘in discussing the outlook for monetary policy, participants anticipated that if the data came in about as expected, with inflation continuing to move down sustainably to 2 percent and the economy remaining near maximum employment, it would likely be appropriate to move gradually toward a more neutral stance of policy over time.’
As a result, the US Dollar may face headwinds ahead of the next Fed rate decision on December 18 as Chairman Jerome Powell and Co. pursue a neutral stance, but the central bank may come under pressure to unwind its restrictive policy at a slower pace as the US Personal Consumption Expenditure (PCE) Price Index warns of sticky inflation.
With that said, USD/JPY may continue to trade to fresh monthly lows amid speculation for a Fed rate-cut in December, but the exchange rate may attempt to retrace the decline from the monthly high (156.75) should the bearish price series unravel.
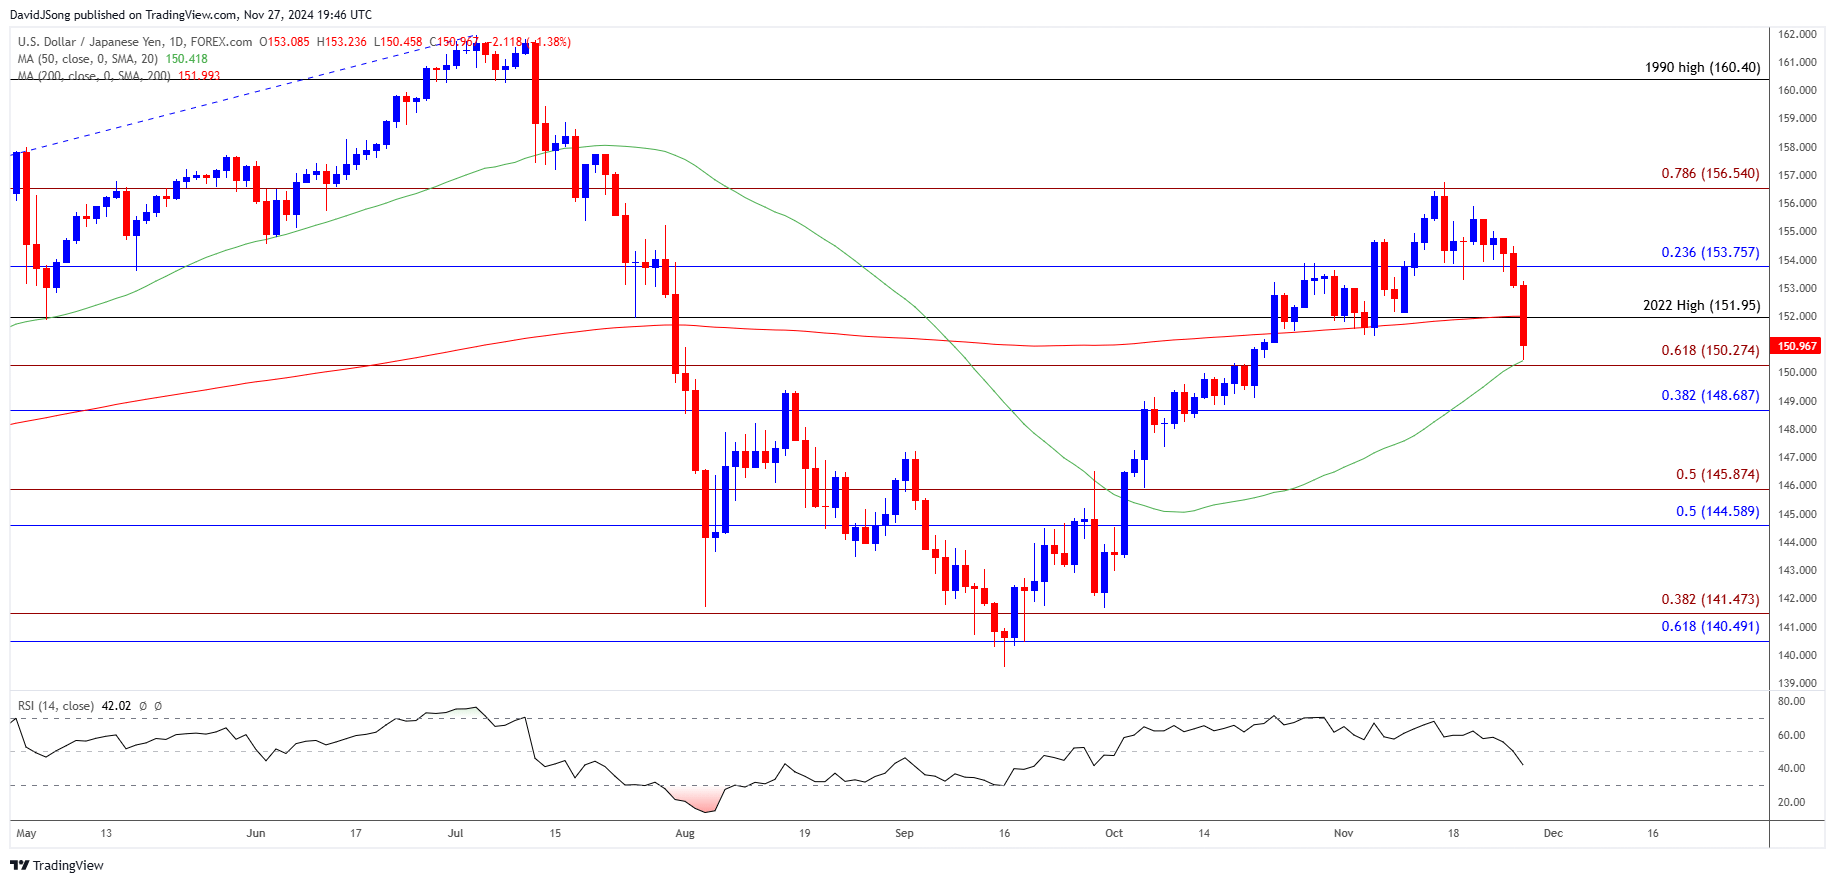
USD/JPY Price Chart – Daily
Chart Prepared by David Song, Strategist; USD/JPY on TradingView
- USD/JPY stages a three-days selloff for the first time since September, with a break/close below the 148.70 (38.2% Fibonacci retracement) to 150.30 (61.8% Fibonacci extension) zone opening up the 144.60 (50% Fibonacci retracement) to 145.90 (50% Fibonacci extension) region.
- Failure to defend the October low (142.97) may push USD/JPY towards the 140.50 (61.8% Fibonacci retracement) to 141.50 (38.2% Fibonacci extension) area, but lack of momentum to close below the 148.70 (38.2% Fibonacci retracement) to 150.30 (61.8% Fibonacci extension) zone may curb the bearish price series.
- Need a move back above 153.80 (23.6% Fibonacci retracement) to bring 156.50 (78.6% Fibonacci extension) back on the radar, with a breach above the monthly high (156.75) raising the scope for a move towards the 1990 high (160.40).
Additional Market Outlooks
US Dollar Forecast: GBP/USD Still Vulnerable to Test of May Low
NZD/USD Rebounds Ahead of 2023 Low with RBNZ Expected to Cut
US Dollar Forecast: USD/CAD to Face Uptick in US PCE Index
Gold Price Stages Five-Day Rally for First Time Since March
--- Written by David Song, Senior Strategist
Follow on Twitter at @DavidJSong
Related tags:



The complete CFD trading experience
Award-winning platforms, competitive spreads, low commissions and dedicated support.
We live and breathe the markets and are dedicated to helping traders realise their ambitions as we continue to set the industry bar.
Economic calendar
Web Trader platform
Our sophisticated web-based platform is packed with features.
Related articles

EUR/USD Forecast: FOREX Friday | October 30, 2026
While the energy shock is a major heading for the euro, the single currency remains supported by a hawkish European Central Bank while growth data in the Eurozone has also been surprisingly resilient. Meanwhile, the dollar faces some near-term positioning risks as markets look ahead to the US midterm elections and given the renewed weakness in technology stocks.


US Dollar Price Action Setups in Central Bank Week
We’ve heard from the Fed, ECB and BoC with the BoJ up next later tonight and DXY trajectory hangs in the balance depending on how hawkish the Bank of Japan might turn out to be.

Gold forecast: XAU/USD struggles as traders eye breakdown
After a three-day recovery, gold prices have fallen in excess of 1.2% so far today, as the metal continues to hover around the $4,000 level. Today’s bearish price action threatens this key level, especially when you consider last week’s 4% sell-off. For now, gold is hanging around this psychological threshold, but it remains to be seen whether it will hold for too long.
StoneX Europe Ltd may make third party material available on this website which may contain information included but not limited to the conditions of financial markets. The material is for information purposes only and does not contain, and should not be construed as containing, investment advice and/or investment recommendation and/or an investment research and/or an offer of or solicitation for any transactions in financial instruments; any decision to enter into a specific transaction shall be made by the client following an assessment by him/her of their situation.
StoneX Europe Ltd makes no representation or warranty and assumes no liability as to the accuracy or completeness of the information provided, nor any loss arising from any investment based on a recommendation, forecast or other information supplied. You should always seek independent advice as to your suitability to speculate in any related markets and your ability to assume the associated risks, if you are at all unsure. We are not under any obligation to update any such material. Any opinion made may be personal to the author and may not reflect the opinion of StoneX Europe Ltd.