


US Dollar Price Action Setups: EUR/USD, USD/JPY, GBP/USD, USD/CAD
The US Dollar remained strong last week even as EUR/USD started to show a series of higher-lows. USD/JPY continues to be bought on dips as the fundamental deviation between the two economies remains front-and-center.
Share this:

US Dollar Talking Points:
- USD strength remained a key theme through FX markets last week but the question now is one of pullback potential.
- EUR/USD has been in meltdown mode but after setting a fresh low after the weekly open, the pair held higher-lows thereafter, illustrating a move that’s a bit long-in-the-tooth.
USD strength continued through last week and at this point, the currency remains overbought on the daily chart and there’s no sign yet that bulls are ready to relent. But – there was a slowing at highs which led to a pattern of lower-highs, and this is something of note as we go into next week.
At this stage, a lack of positives doesn’t automatically mean a negative, it’s just a deductive observation. But, if looking on the long side of the USD it does mean caution should be exercised because of how stretched that move already is.
With the Monday high that held through the rest of the week, we also have an early-stage illustration of RSI divergence, where RSI posted a lower-high even as price set a higher-high. This is the kind of thing that can eventually lead into a reversal, but as I said in a tweet earlier in the week, it’s as if the market is waiting for a reason or some degree of motive to begin the move.
Perhaps next week’s CPI report on Wednesday is what delivers that?
US Dollar Daily Chart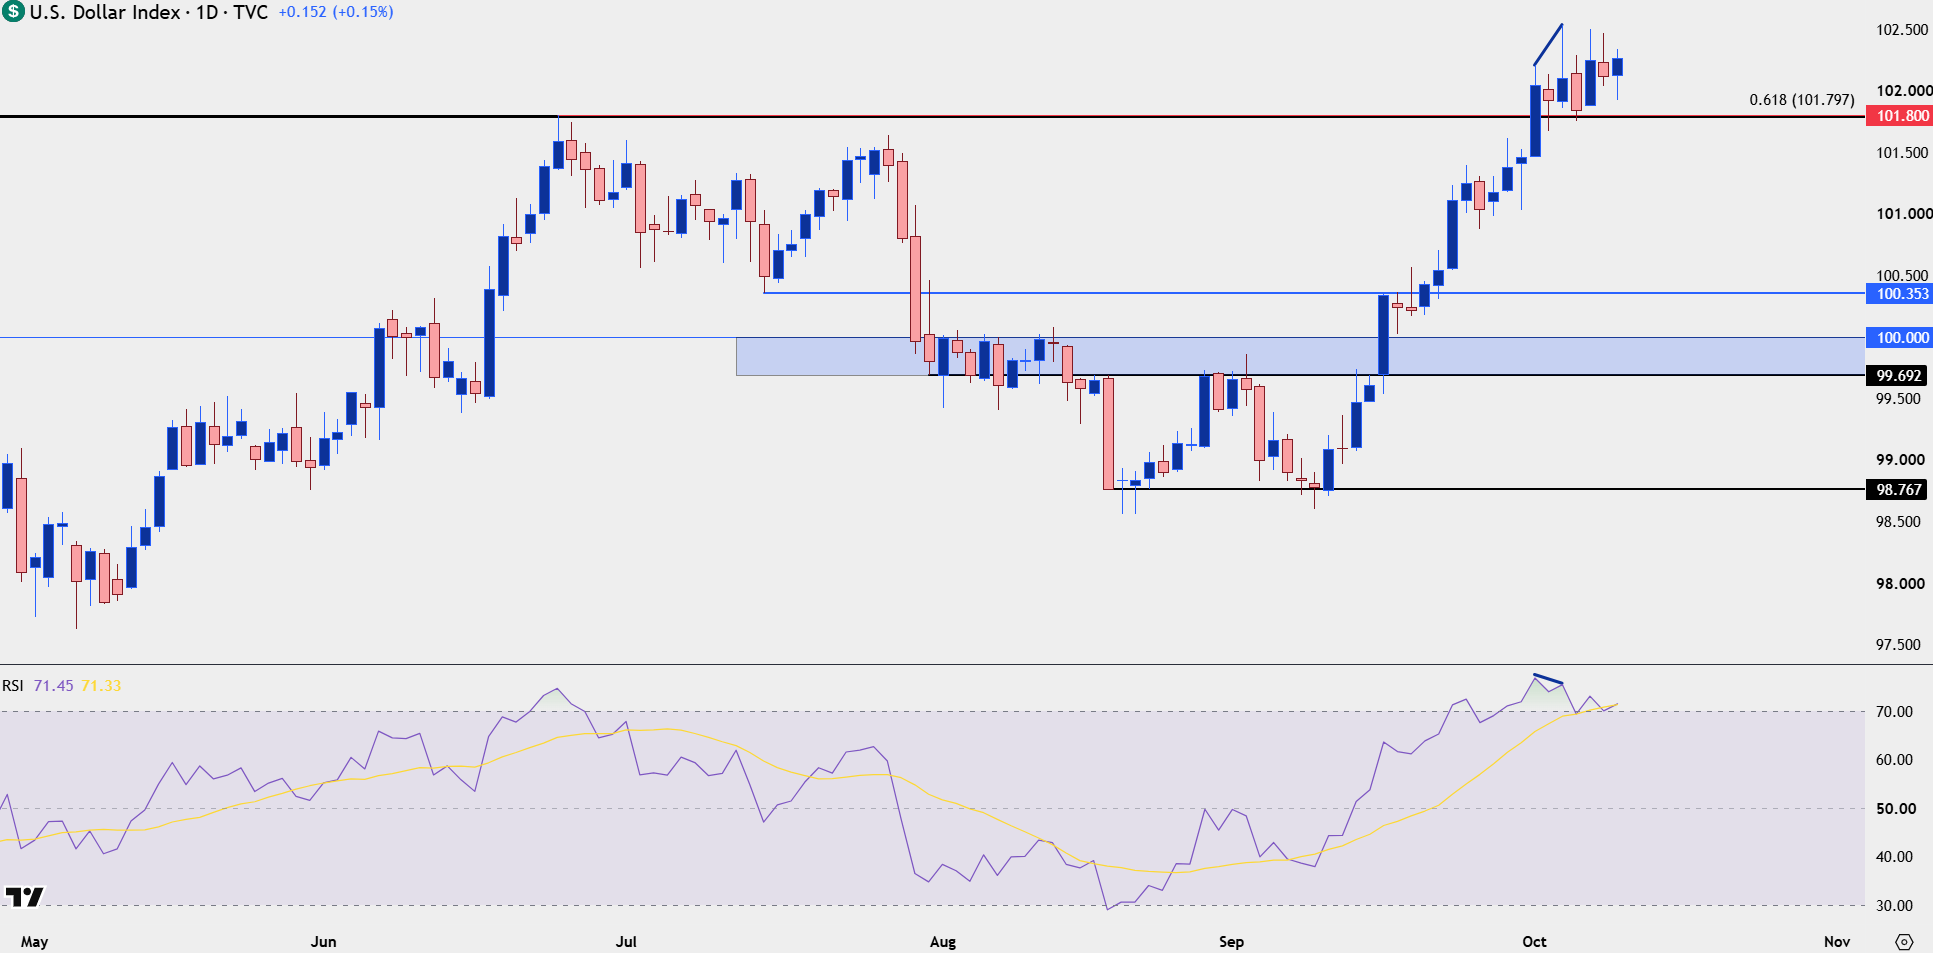
Chart prepared by James Stanley; data derived from Tradingview
EUR/USD
The Euro has been in meltdown mode and at this point it mirrors that backdrop in USD quite well. This is a change of pace from the previous read where USD/JPY seemed to be driving USD-strength as the big picture carry trade very much remained in force. But, since the dual intervention in late-July, it’s been the Euro meltdown that’s been the more decisive driver of USD-strength.
In EUR/USD, the pair remains in oversold territory on the daily, and there was a similar indication of higher-lows via RSI to go along with lower-lows in price. And after a splash on the weekly open, the pair posted higher-lows into the end of the week.
Again, this is deductive and diminishing negatives doesn’t automatically spell a positive, but it can be an early first step.
EUR/USD Daily Chart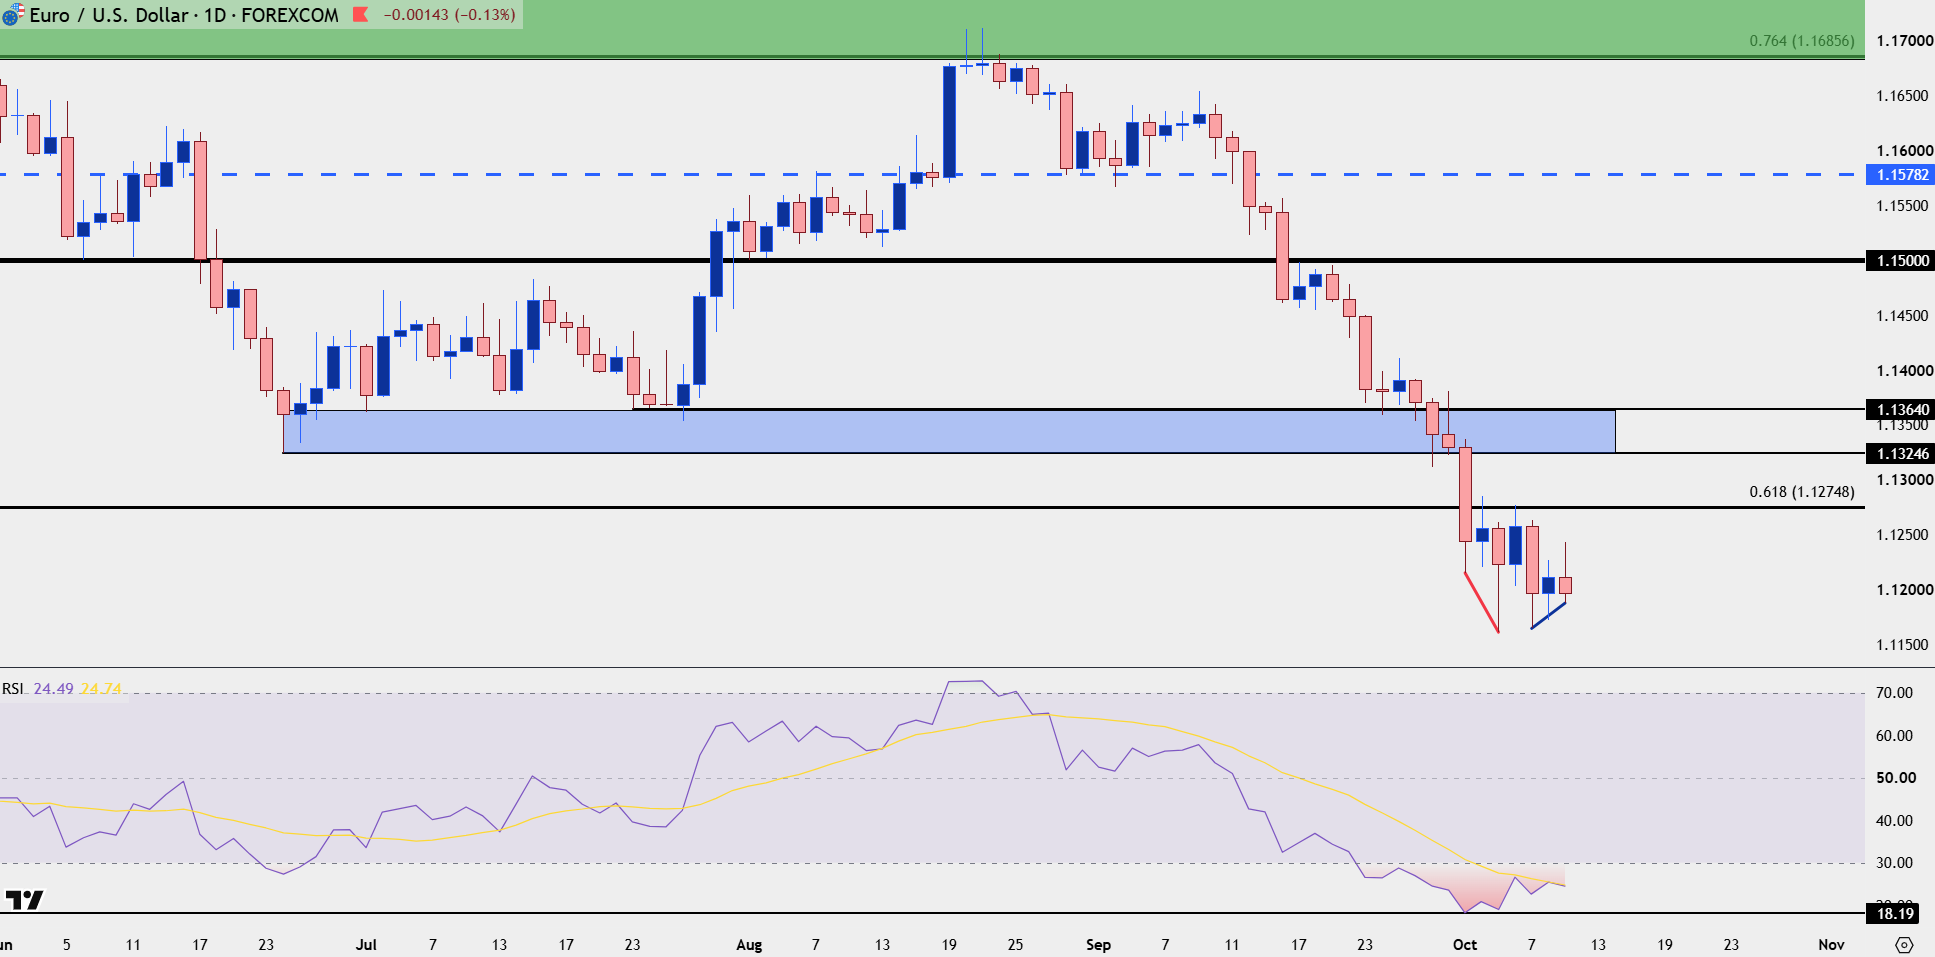
Chart prepared by James Stanley; data derived from Tradingview
GBP/USD
If looking for USD-weakness, I think GBP/USD is set up more attractively at this point. While EUR/USD set a fresh low just after the weekly open, GBP/USD held above the prior week low, and from the weekly chart, we can see another item of indecision which, again, diverges quite nicely from the EUR/USD sell-off over the past couple of weeks.
From the weekly chart below, a clean range shows price still very near support, which again highlights that bullish case for those looking at ways to take on bearish USD exposure.
GBP/USD Weekly Chart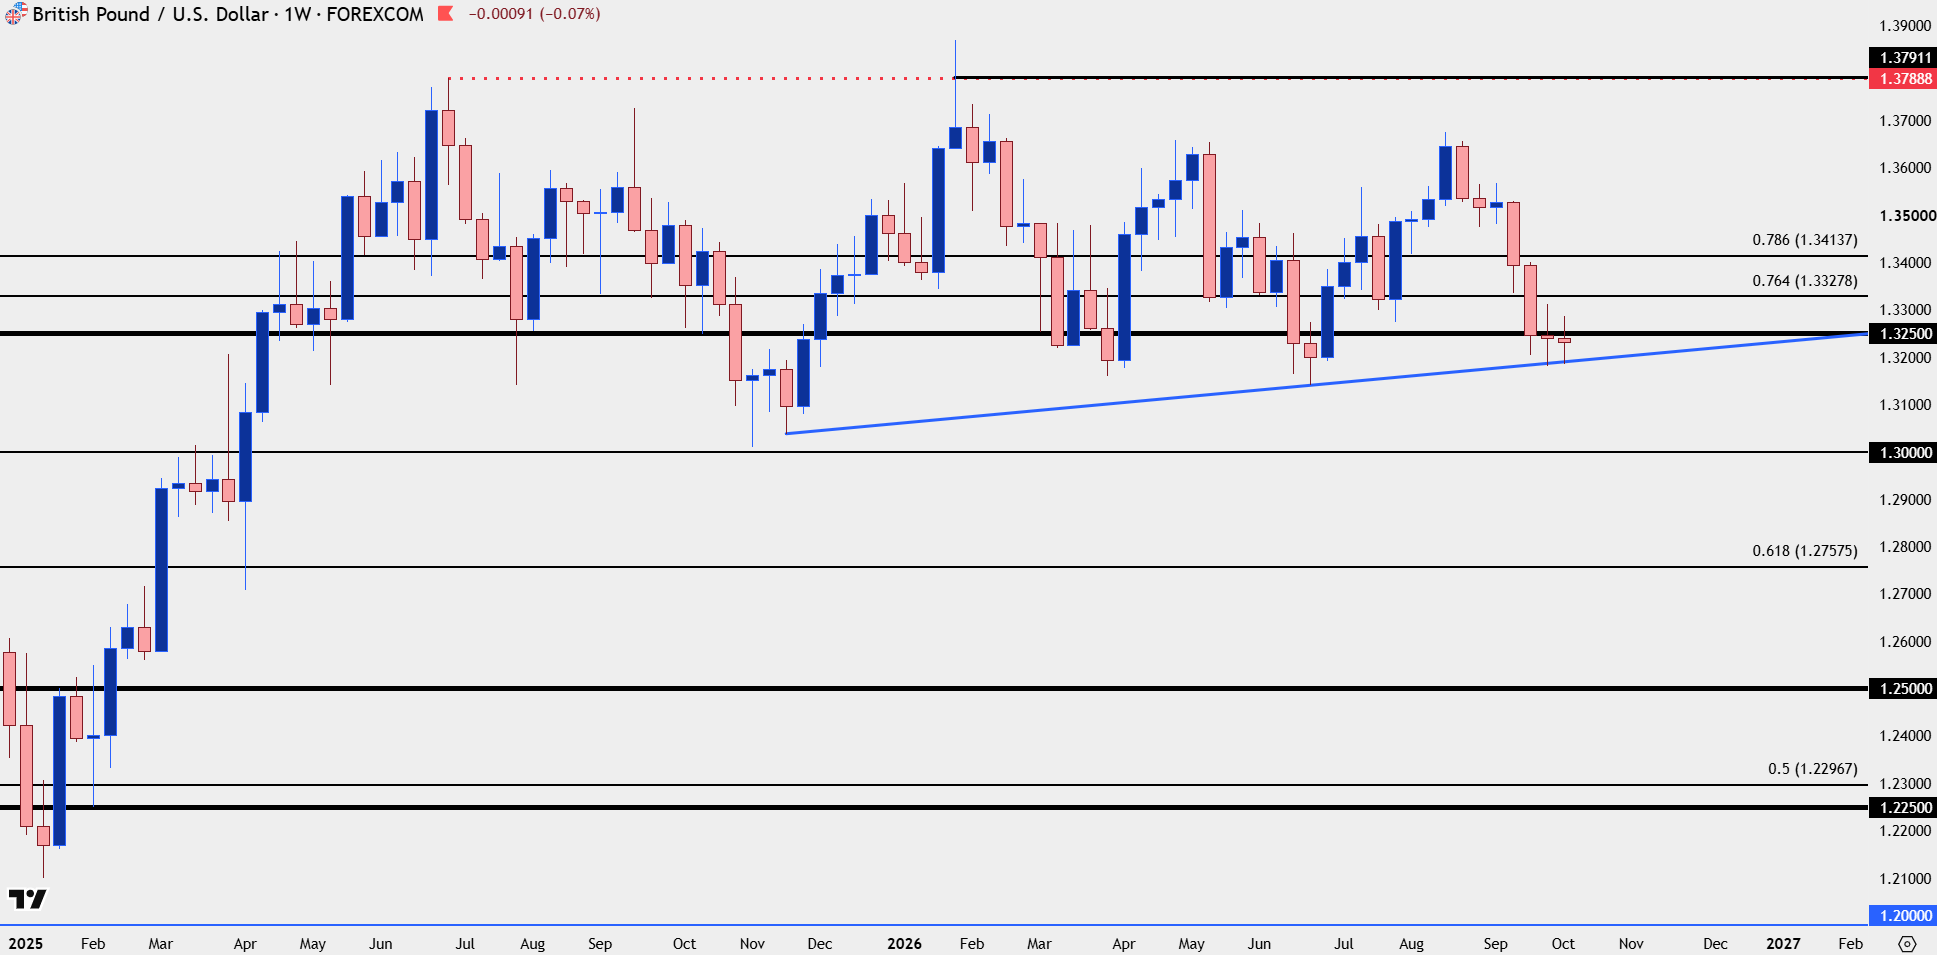
Chart prepared by James Stanley; data derived from Tradingview
USD/JPY
For USD-strength, I think USD/JPY is still a more compelling option, with the caveat that upside seems to have a theoretical cap after the dual intervention from both the US and Japan. So that makes the 164 a troubling area and possibly even 160, but pullbacks have continued to catch bids from buyers and that’s something that can keep the door open for a push up to the 159.00 handle, until something changes.
For support structure, it’s still the 156.68-157.22 zone that has been well defended, and then last week saw a higher-low develop at 157.50 which illustrates a degree of bullish anticipation.
USD/JPY Daily Chart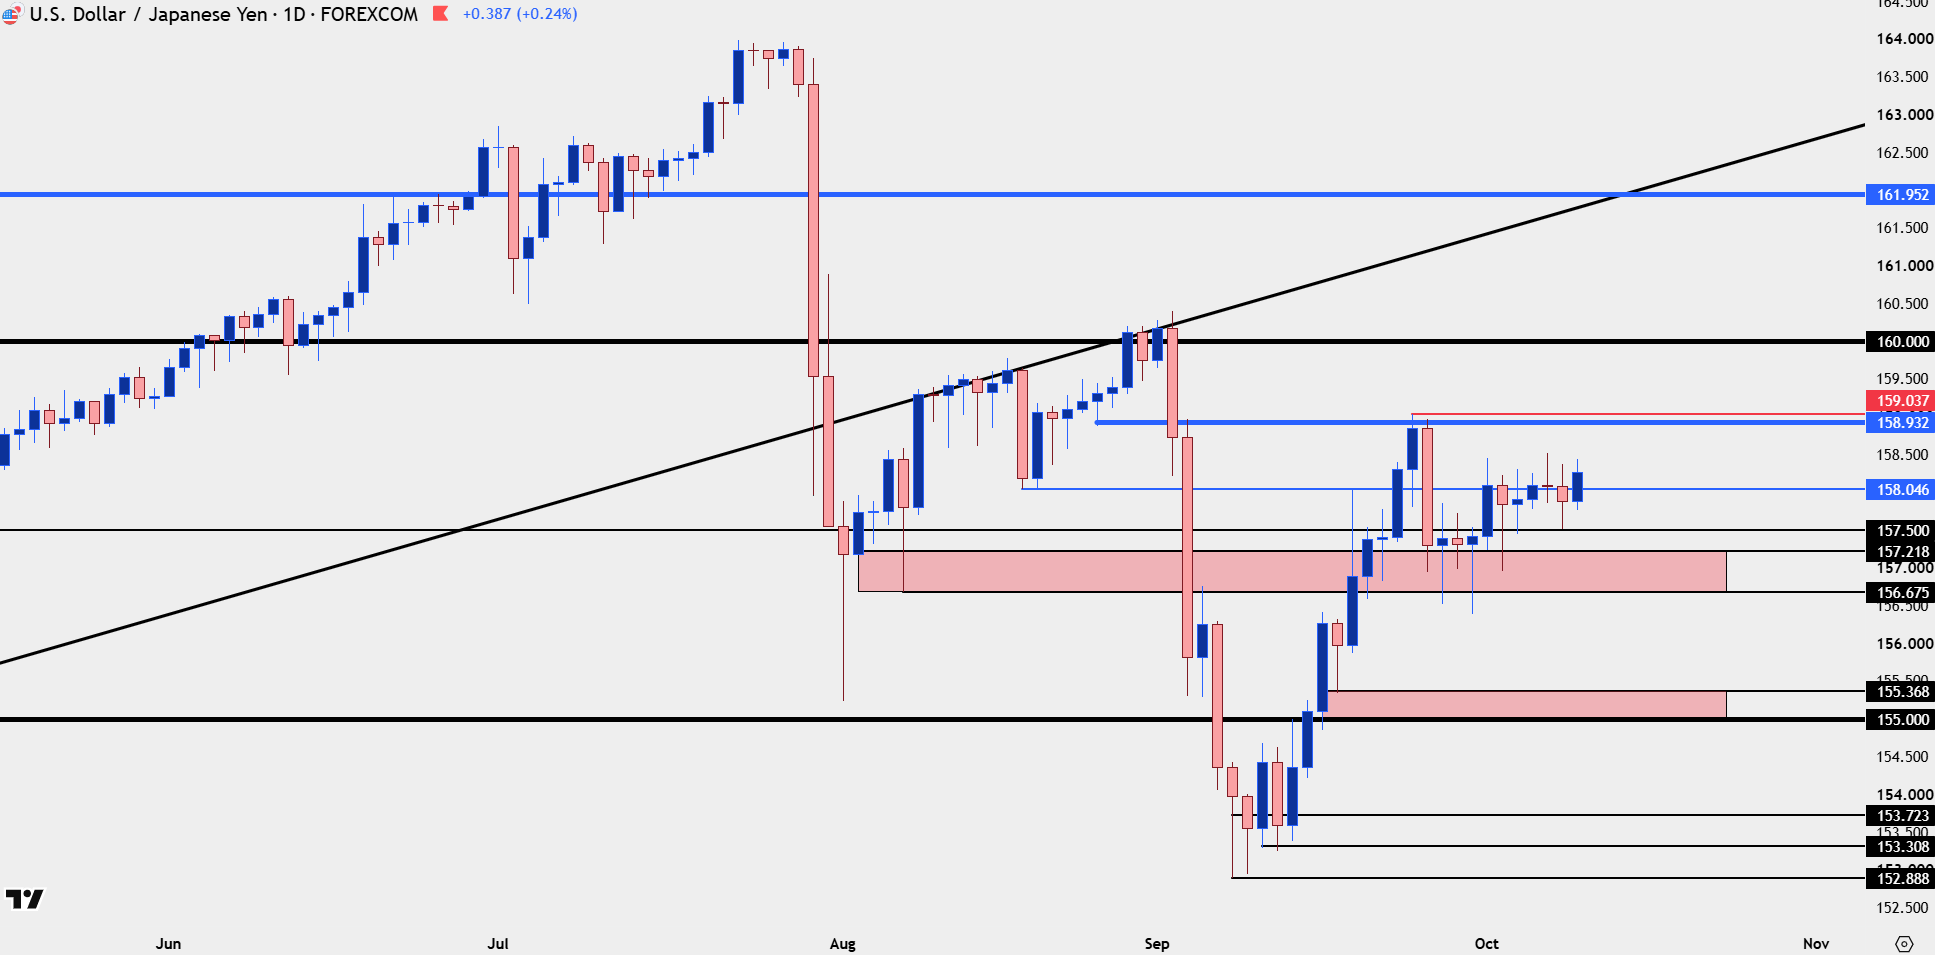
Chart prepared by James Stanley; data derived from Tradingview
USD/CAD
Also compelling on the long side of the USD is USD/CAD.
The pair had a strong streak during the DXY rally and that began to cool earlier last week. But, a Friday breakout and print of a frehs high at the 1.4300 level highlights a case of divergence, as the pair was able to set a fresh high while DXY was not. That illustrates the addition of CAD-weakness and as we go into next week, there’s been a consistent range on a short-term basis that offers support at either the mid-line, around 1.4250, or range support, just above the 1.4200 handle.
USD/CAD Four-Hour Chart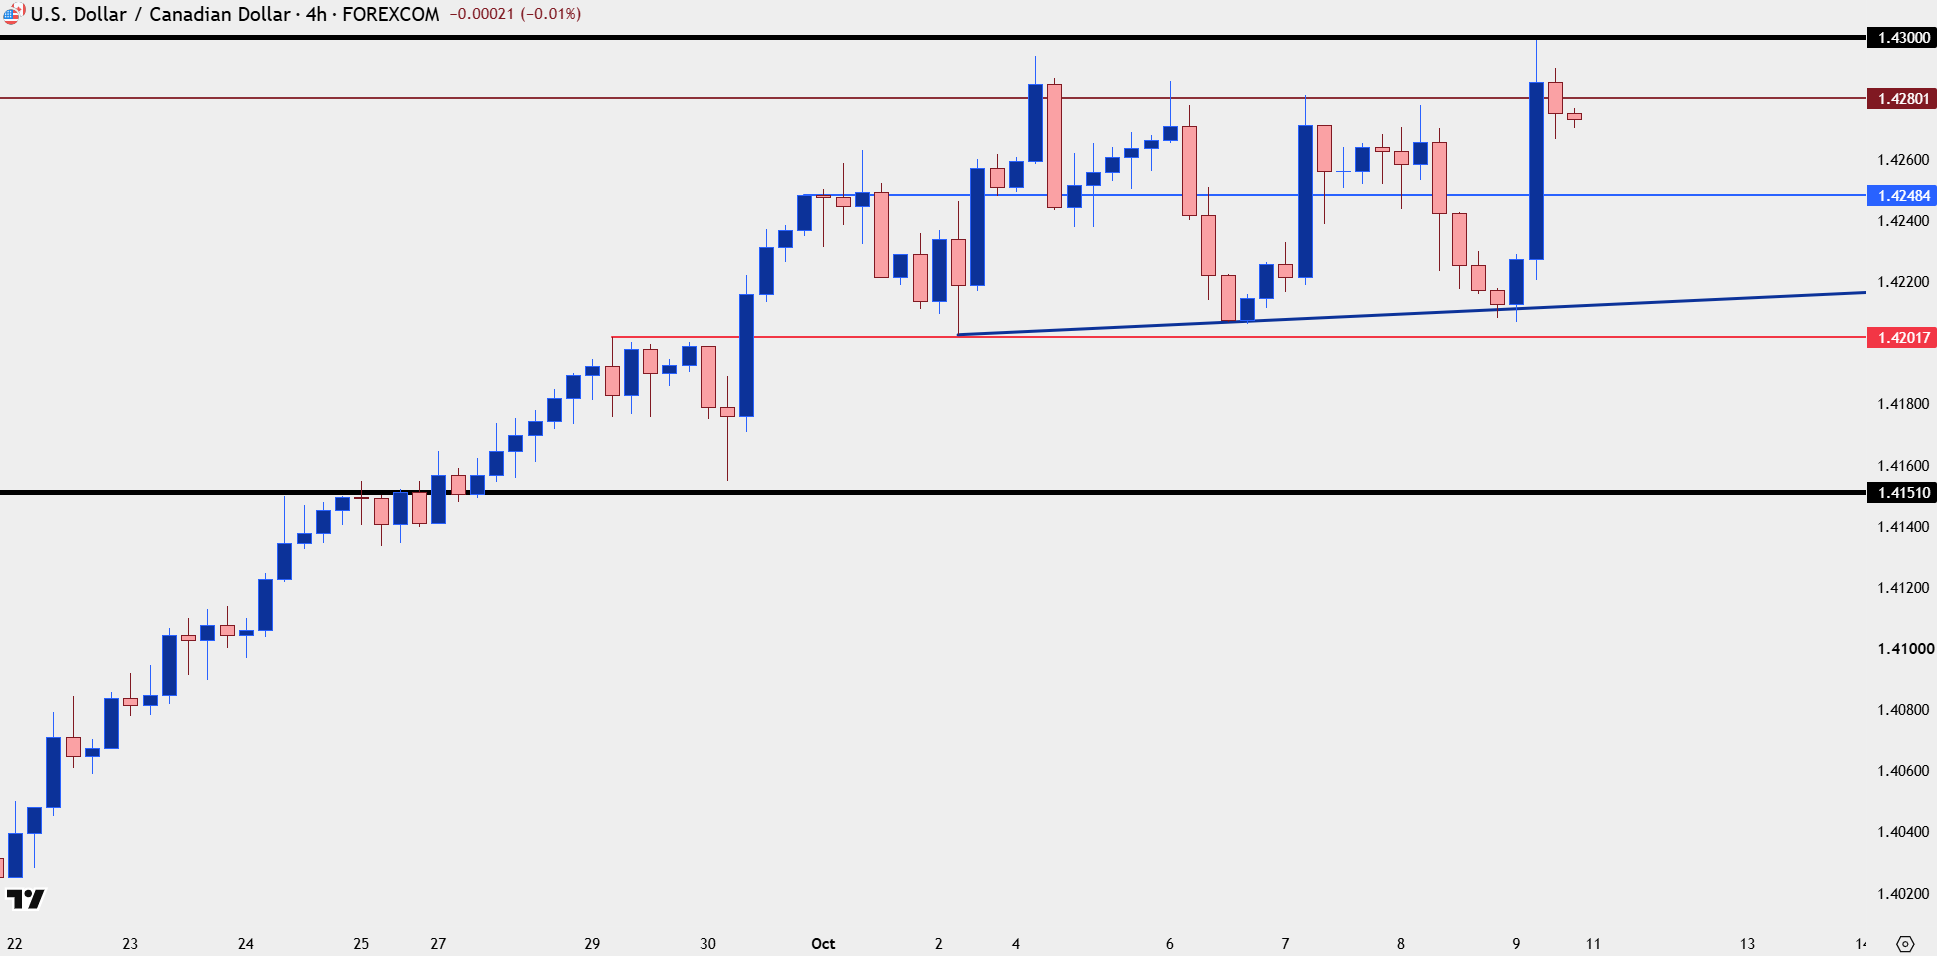
Chart prepared by James Stanley; data derived from Tradingview
--- written by James Stanley, Senior Market Analyst, Global Macro
Latest market news




The complete CFD trading experience
Award-winning platforms, competitive spreads, low commissions and dedicated support.
We live and breathe the markets and are dedicated to helping traders realise their ambitions as we continue to set the industry bar.
Economic calendar
Web Trader platform
Our sophisticated web-based platform is packed with features.
Related articles
US Dollar Price Action Setups: EUR/USD, USD/JPY, GBP/USD, USD/CAD
The US Dollar remained strong last week even as EUR/USD started to show a series of higher-lows. USD/JPY continues to be bought on dips as the fundamental deviation between the two economies remains front-and-center.
Dow Jones Forecast: DJIA rises as Oil slips and Treasury yields pause
U.S. stocks are rising on Friday as oil prices ease on signs of reduced Middle East supply risks, although the telecom sector remains under pressure following SpaceX’s acquisition deal.


USD/JPY falters, EUR/USD awaits French bond verdict
The yen has reacted to falling US yields, but the euro faces a different problem. Could French government bond yields provide the additional push needed to break EUR/USD's downtrend?

StoneX Europe Ltd may make third party material available on this website which may contain information included but not limited to the conditions of financial markets. The material is for information purposes only and does not contain, and should not be construed as containing, investment advice and/or investment recommendation and/or an investment research and/or an offer of or solicitation for any transactions in financial instruments; any decision to enter into a specific transaction shall be made by the client following an assessment by him/her of their situation.
StoneX Europe Ltd makes no representation or warranty and assumes no liability as to the accuracy or completeness of the information provided, nor any loss arising from any investment based on a recommendation, forecast or other information supplied. You should always seek independent advice as to your suitability to speculate in any related markets and your ability to assume the associated risks, if you are at all unsure. We are not under any obligation to update any such material. Any opinion made may be personal to the author and may not reflect the opinion of StoneX Europe Ltd.