



US Dollar Price Action Setups: Gold Breakout, EUR/USD, USD/CAD, USD/JPY
The USD started the week with a rally but was soon swatted down, helping gold to breakout (again) at the $3500 level.
Share this:

US Dollar Talking Points:
- The US Dollar started the week with a rally but was swatted down after the US open when Bill Pulte commented on Lisa Cook, which also helped Gold to push back above the $3500 level.
- The weekly US Dollar chart shows a lot of missed opportunity from bulls to re-take control of the trend, with upper wicks showing commonly over the past couple of months. This was a center-point for the discussion in this week’s webinar.
- To join the next webinar, you’re welcome to register. Click here to register.
The US Dollar started this week with a rally, but that was quickly swatted down after the US open when the director of the Federal Housing Finance Agency said that there was an announcement on Fed Governor, Lisa Cook. That announcement turned out to be him saying that there was now video evidence that a home that Cook had declared as a primary residency was being rented out, which alleges misuse of an important part of American tax code. This has been an underlying argument for President Trump’s attempt to replace Cook which could make for a more amenable Federal Reserve for his rate cut hopes. In response to this morning’s news, the US Dollar reversed from an earlier rally, and Gold broke out again above the $3500 level.
Bigger picture, the US Dollar hasn’t been able to craft a fresh low since doing so on the first day of Q3. And with the final month of the quarter starting, it’s been a choppy couple of months for the USD and, in-turn, major FX pairs. While Trump has pushed hard for a rate cut, to the point where markets are still heavily expecting the Fed to cut rates at their next meeting in September to a 90% clip, inflation in the US remains high as evidenced by last Friday’s Core PCE print at 2.9% YoY.
So, perhaps the bigger question is: If the Fed does cut rates, how will markets respond with long-term US debt? Will they sell Treasuries like they did after last year’s September rate cuts, with the 10-year moving from below 3.6% the day before the cut to 4.8% in early-January?
That could be problematic for the US economy as mortgage rates are more tied to longer-term rates rather than the overnight rates that the Fed adjusts. And this matters for the US Dollar because DXY rode a similar trajectory as US yields, with DXY setting a low at 100.22 on the day of the Fed’s cut in September of last year, and then rallying aggressively in Q4 – even as the Fed continued to cut.
In the USD right now, the currency has seen the sell-off from the first-half of the year stall, but bulls haven’t exactly had their way as you can see from the upper wicks on the weekly chart for the past couple of months.
US Dollar Weekly Chart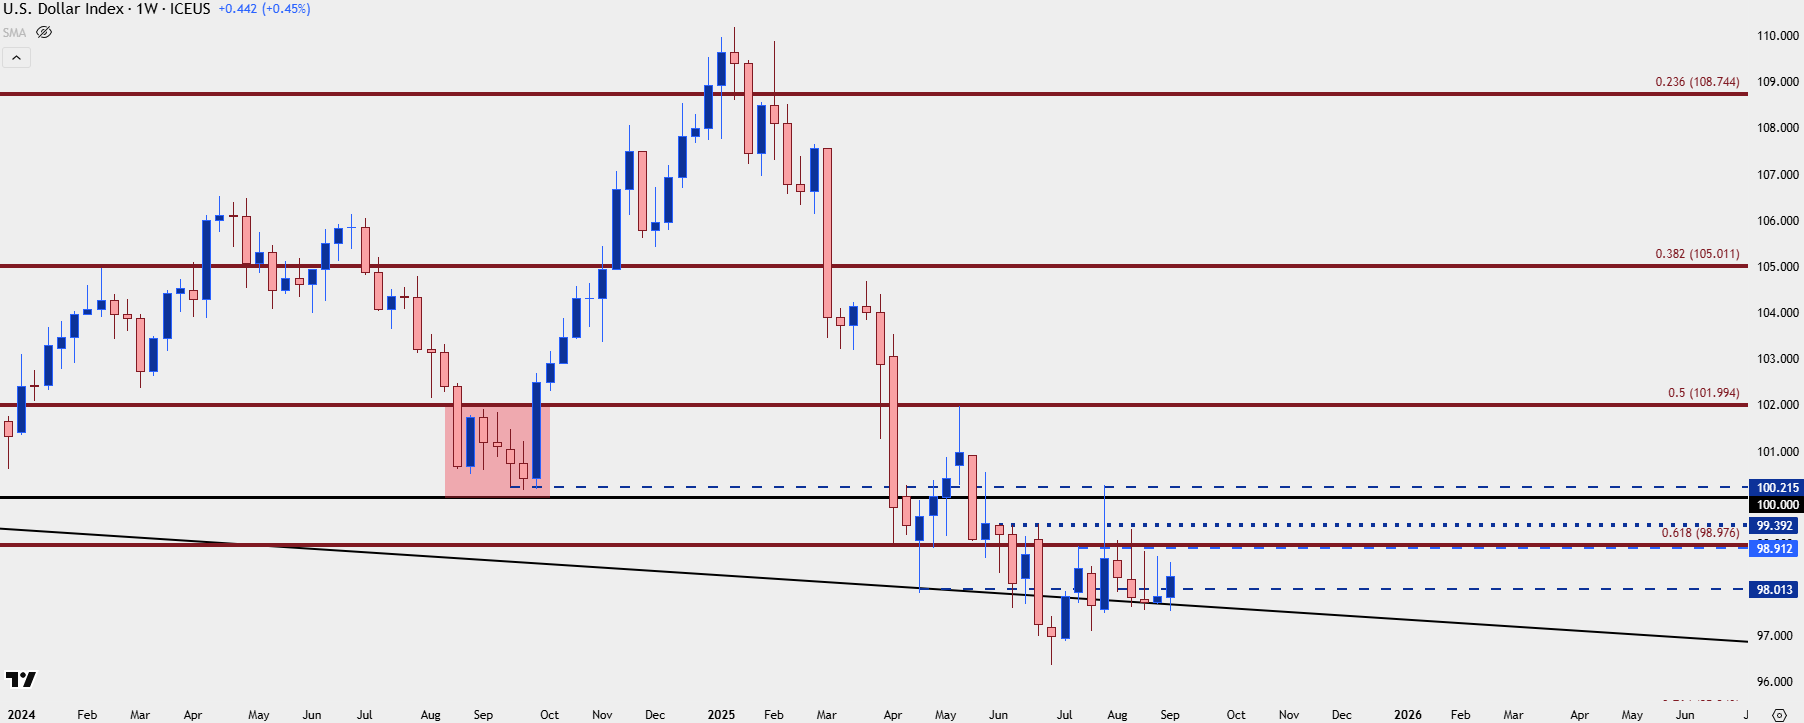
Chart prepared by James Stanley; data derived from Tradingview
Gold
I started this webinar with gold and I think that the fundamental backdrop remains attractive for such.
Just a couple of weeks ago, ahead of Jerome Powell’s speech at Jackson Hole, I highlighted a bull pennant formation in gold, very similar to the setup that built in the final two months of last year. That formation has since led to bullish breakout, with buyers re-engaging with the $3500 level again -which is the same that came into play before a 10% pullback in Q2.
That $3500 level gave an initial resistance reaction after the weekly open, but it was the comments towards Lisa Cook that seemed to prod the metal back-above. The big question now is whether the big figure elicits selling from longer-term bulls, which could lead to pullback scenarios.
For that, there’s support potential at $3451, $3435 and $3400, after which a bullish trendline projection comes into play right around the $3350 area of prior support.
Gold Daily Price Chart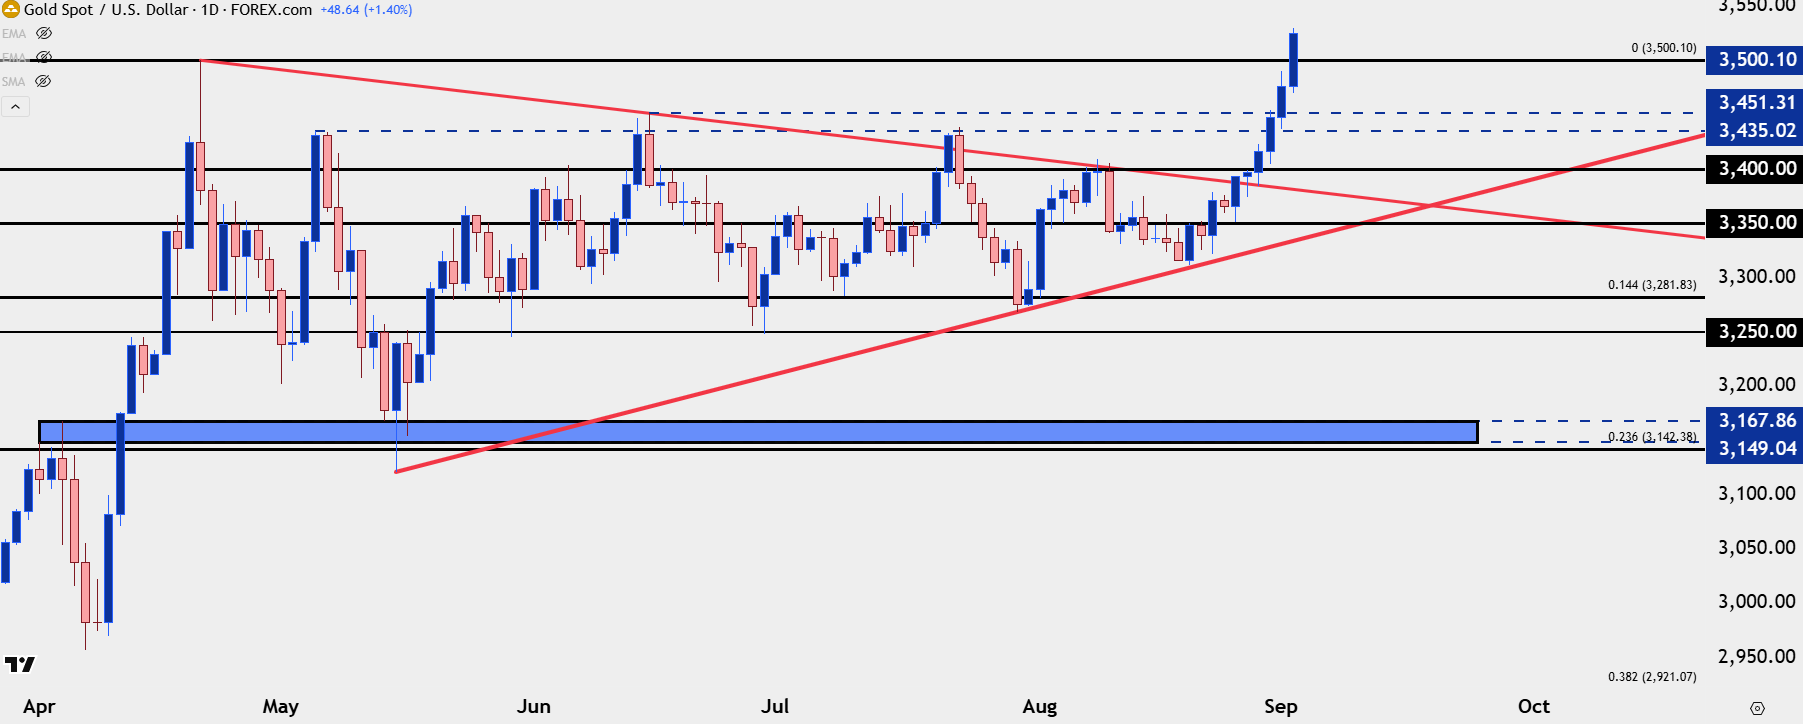
Chart prepared by James Stanley; data derived from Tradingview
EUR/USD
As the USD sell-off has stalled so far in Q3, so too has the rally in EUR/USD. Bears have had an open door to prod a deeper pullback but, so far, they’ve been thwarted at every turn. Most recently, it was a trendline projection coming into play this morning, which sets up a similar bull pennant formation given the continuation of both lower-highs and higher-lows.
In the webinar, I linked this to last Q3, when EUR/USD was strong into and around the Fed’s first cut. But it was after the Fed cut that the Q4 rally took over in the USD, and that led to a precipitous drop in EUR/USD. I went over a couple of different scenarios for something of that nature in the webinar.
A shorter-term inverse head and shoulders can also be argued, which opens the door for breakout. But perhaps the more interesting scenario is a breakout that bulls don’t show up to continue, which could lead to a capitulation theme into or perhaps around the Q4 open, after the Fed has cut rates, similar to last year’s scenario.
EUR/USD Daily Chart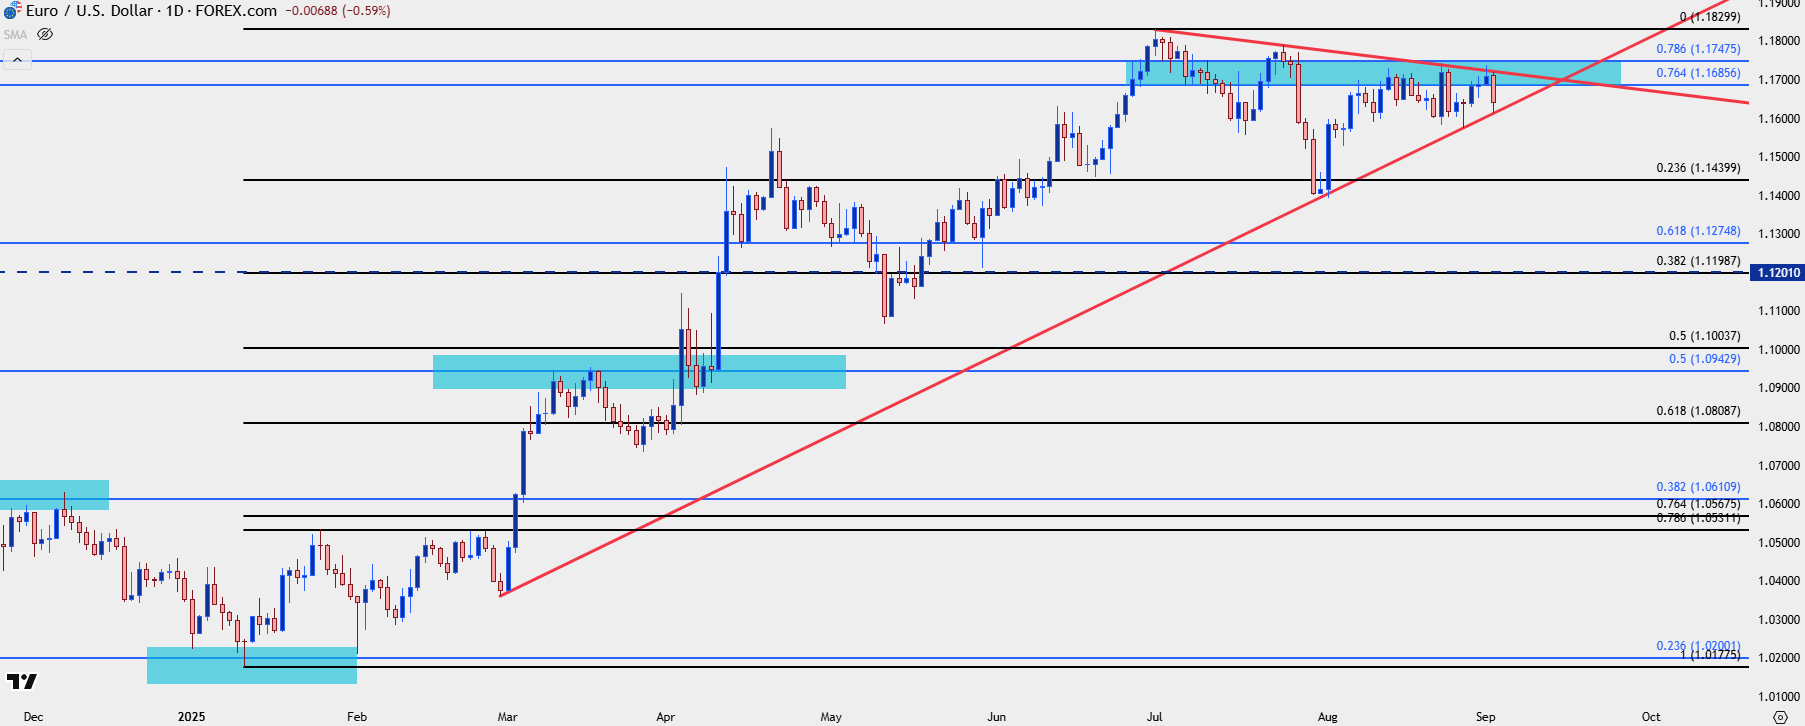
Chart prepared by James Stanley; data derived from Tradingview
USD/CAD
USD/CAD is perhaps a cleaner venue for USD-strength, as last week saw the pair push up to a fresh high at the 1.3900 handle, and that’s been followed by a pullback to support at prior resistance, around 1.3750. Importantly, the pair has so far held a higher-low above the prior 1.3750 test and that keeps the door open for bullish continuation setups in the pair.
USD/CAD Daily Price Chart
Chart prepared by James Stanley; data derived from Tradingview
USD/JPY
While the USD set a fresh low on the first day of Q3, USD/JPY did not. Instead, the pair held a higher-low and has continued to grind-higher. Bulls haven’t exactly been able to run away with a trend, but the deduction is important, I think, as the Yen plays a massive 13.6% role in the DXY basket. Perhaps more importantly, it was the low in April that synced with the equity recovery in US equities which highlights the fact that a larger USD breakdown, which would likely need some help from USD/JPY, could have negative connotation elsewhere, such as stocks.
Of recent, the pair has been quite range bound and as I said in the webinar, this is something I would want to approach with an upward bias until evidence suggests otherwise. But, there could be more attractive venues for seeking out JPY-weakness, such as EUR/JPY or perhaps even GBP/JPY.
USD/JPY Weekly Chart
Chart prepared by James Stanley; data derived from Tradingview
--- written by James Stanley, Senior Strategist


The complete CFD trading experience
Award-winning platforms, competitive spreads, low commissions and dedicated support.
We live and breathe the markets and are dedicated to helping traders realise their ambitions as we continue to set the industry bar.
Economic calendar
Web Trader platform
Our sophisticated web-based platform is packed with features.
Related articles

USD/CAD reversal risk builds as central bank showdown looms
USD/CAD has delivered a bullish reversal signal from established support, just as traders prepare for Fed and BoC decisions. Aggressive Canadian rate hike expectations and conflicting momentum signals make the coming session important.


EUR/USD weekly outlook: FOMC and ECB to set the tone
The current backdrop is modestly bearish. On Friday, the EUR/USD closed modestly lower, down for the third consecutive day. The pair also posted a weekly decline after staging a modest recovery attempt in the previous week. Out of the past 8 weeks, the EUR/USD has fallen on 6 occasions. There is not much supporting factors for the single currency right now. So, the upside remains capped.


Gold Does Something it Hasn’t Done in a Year, is Larger Risk-Off Afoot?
With tech stocks getting hit harder last week there was collateral damage elsewhere, including gold as the metal closed below the $4k level for the week and that’s the first time that’s happened to spot gold in more than a year.
StoneX Europe Ltd may make third party material available on this website which may contain information included but not limited to the conditions of financial markets. The material is for information purposes only and does not contain, and should not be construed as containing, investment advice and/or investment recommendation and/or an investment research and/or an offer of or solicitation for any transactions in financial instruments; any decision to enter into a specific transaction shall be made by the client following an assessment by him/her of their situation.
StoneX Europe Ltd makes no representation or warranty and assumes no liability as to the accuracy or completeness of the information provided, nor any loss arising from any investment based on a recommendation, forecast or other information supplied. You should always seek independent advice as to your suitability to speculate in any related markets and your ability to assume the associated risks, if you are at all unsure. We are not under any obligation to update any such material. Any opinion made may be personal to the author and may not reflect the opinion of StoneX Europe Ltd.