



US Dollar Rally Builds Momentum, Crude Oil Holds the Key
The US dollar eyes 102 as soaring crude oil prices, geopolitical tensions and hawkish Fed bets combine to strengthen the bullish case.
Share this:
The US dollar is building momentum as crude oil prices surge on escalating tensions in the Middle East, reviving inflation concerns and lifting expectations for further Federal Reserve tightening. While futures positioning is approaching a bullish extreme, technical and macro signals suggest the US Dollar Index (DXY) may still have room to extend towards 102.
View related analysis:
View related analysis:
Crude Oil Surges as Middle East Tensions Escalate
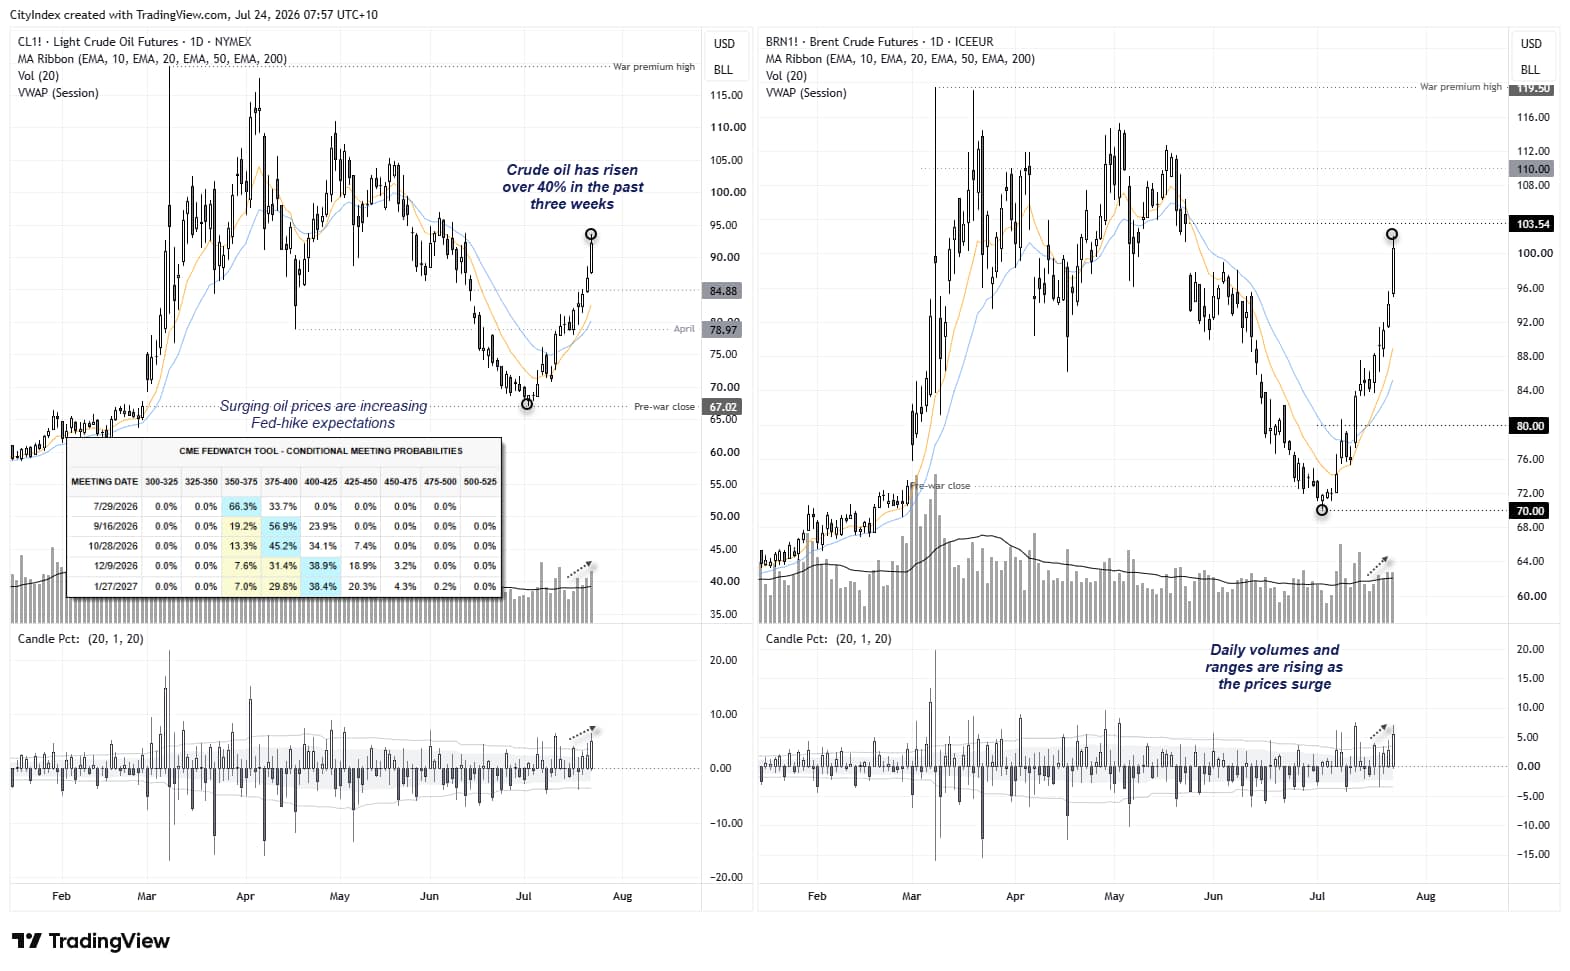
Crude oil prices extended their rally on Thursday as escalating tensions in the Middle East fuelled fears of further supply disruptions. Iran-backed Houthi rebels claimed responsibility for attacks on two Saudi oil tankers in the Red Sea, while the US launched another round of strikes on Iranian targets, prompting President Trump to vow "major military punishment". With shipping risks rising across both the Bab el-Mandeb Strait and Strait of Hormuz, traders pushed up the geopolitical risk premium in crude.
Crude oil has rallied more than 40% in just three weeks, renewing concerns about inflation and the potential for a prolonged conflict in the Middle East. Note on the daily WTI and Brent crude charts that trading volumes and daily volatility are increasing as the rally matures and supply disruption fears continue to underpin sentiment. Brent crude is trading above $100 and within sight of the 26 May gap resistance, leaving it up around 45% from its recent low.
Source: NYMEX, ICE, TradingView


US Dollar Sentiment Nears an Extreme, Though Crude Oil Holds the Key
The US dollar also strengthened as investors sought safe-haven assets, while higher oil prices reinforced inflation concerns, lifting US Treasury yields and increasing expectations for further Federal Reserve tightening. Fed funds futures currently imply a 57% probability of a rate hike in September and a 39% chance of a follow-up increase in December.
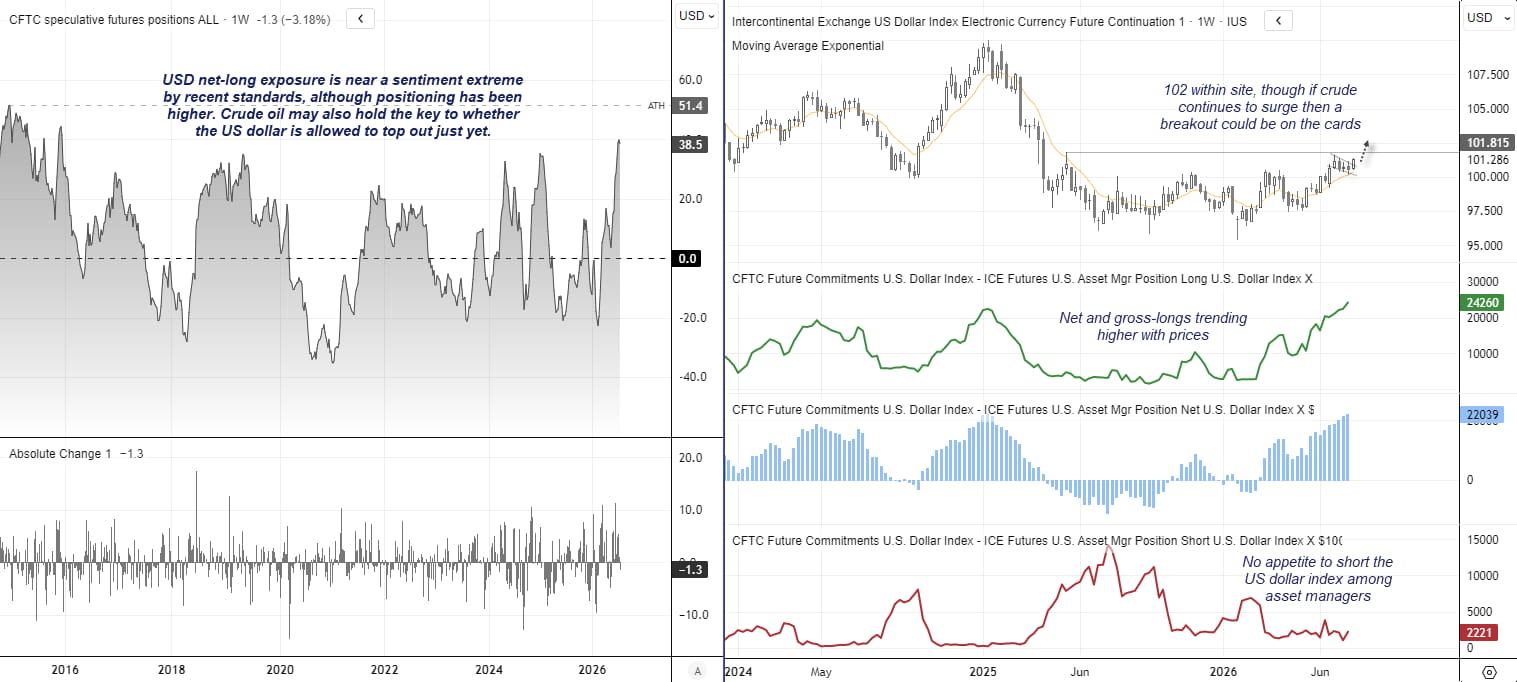
I have noted in recent COT report articles that bullish exposure in the US dollar futures market may be approaching a sentiment extreme. However, given the data is published with a one-week lag, it does not necessarily signal a market top—only something to monitor in the weeks ahead. It could still allow the US dollar index to reach my 102 upside target over the near term.
If traders are ultimately dealt a swift resolution to the conflict in the Middle East, crude oil prices could reverse lower, dragging the US dollar with them as inflation concerns ease and expectations for further Federal Reserve tightening are scaled back.
This content was created by an affiliate of FOREX.com and represents the views and opinions of the author/speakers, not the views and opinions of FOREX.com, StoneX Group Inc., or its subsidiaries. The content has not been independently reviewed by FOREX.com.
US Dollar Index Targets 102, Bull Flag Remains in Play
According to the latest COT data, aggregate net-long exposure to the US dollar stood at $38.5 billion, just $1.3 billion below the 10-year high reached the previous week. Asset managers' net-long exposure rose to a 78-week high of 22,000 contracts. While this may represent a sentiment extreme by recent standards, positioning exceeded 300,000 net-long contracts in 2022. If crude oil prices continue to rise, the US dollar could still have room to extend its rally.
Ther weekly US dollar index chart remains in a solid uptrend and is respecting the 10-week EMA. And with momentum turning higher from a potential bull flag pattern, the May high (101.82) and 102 seem are within site for US dollar bulls. A break above here assumes trend continuation.
Source: CFTC (COT), IMM, ICE, LSEG
US Dollar Index (DXY) Technical Analysis
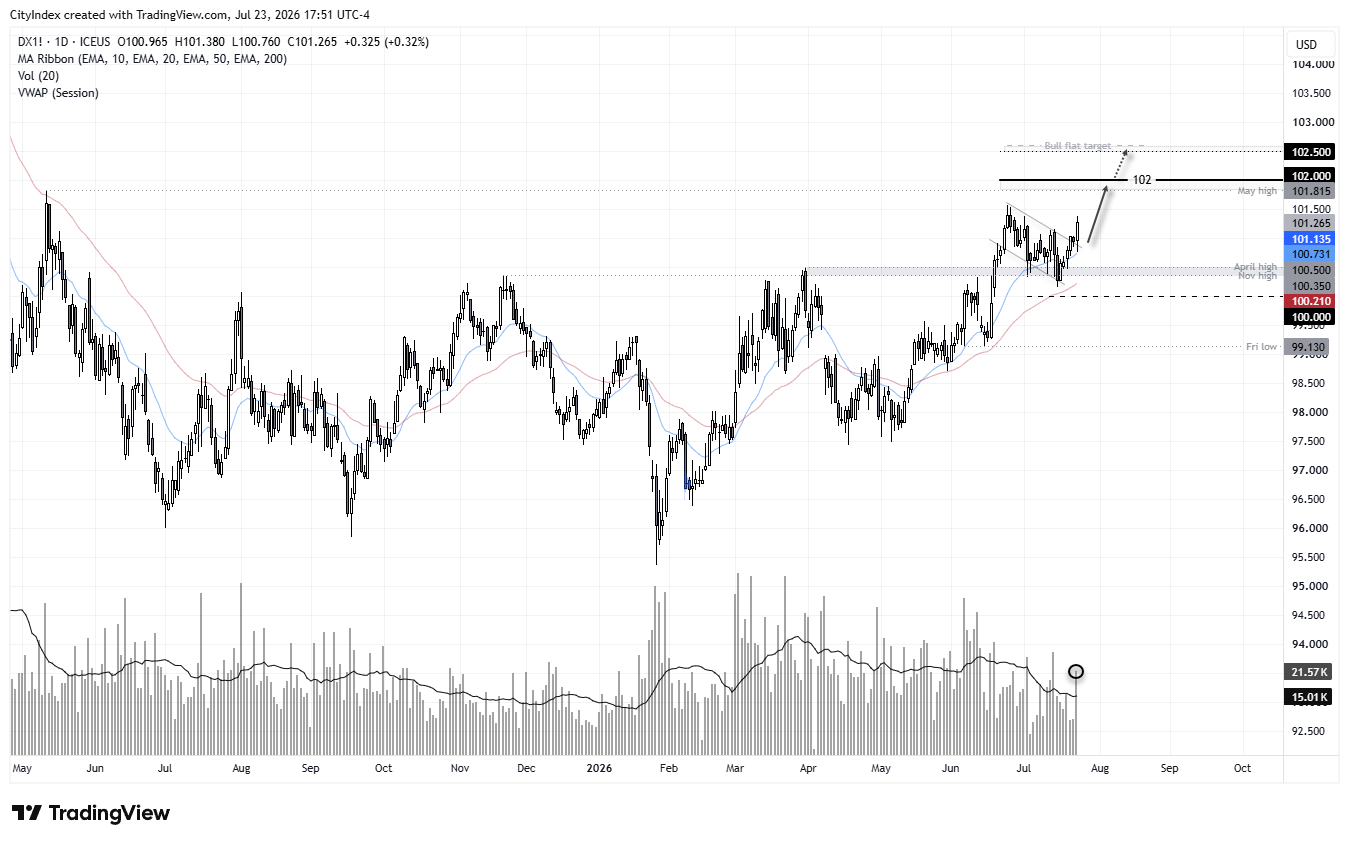
The daily chart shows momentum is clearly turning higher and realigning with the broader bullish trend. The 20- and 50-day EMAs are behaving like a support cloud, while the notable increase in trading volume on Thursday suggests strong bullish participation following the rebound from the 20-day EMA. A breakout from a bull flag appears to be underway.
The flag projects an approximate upside target of 102.50, although 102 is an obvious level where an initial shakeout could occur if prices continue higher from here. My bias remains bullish while prices hold above last week's swing low, although the November and April highs, along with the 20-day EMA, are also potential support levels where bulls may look to buy any retracement.
Source: ICE, TradingView
View the full economic calendar
View the full economic calendar
-- Written by Matt Simpson
Follow Matt on Twitter @cLeverEdge
How to trade with City Index
You can trade with City Index by following these four easy steps:
- Open an account, or log in if you’re already a customer
• Open an account in the UK
• Open an account in Australia
• Open an account in Singapore
- Search for the market you want to trade in our award-winning platform
- Choose your position and size, and your stop and limit levels
- Place the trade
Latest market news




The complete CFD trading experience
Award-winning platforms, competitive spreads, low commissions and dedicated support.
We live and breathe the markets and are dedicated to helping traders realise their ambitions as we continue to set the industry bar.
Economic calendar
Web Trader platform
Our sophisticated web-based platform is packed with features.
Related articles
USD/JPY Forecast: Is Rising Japanese Inflation Supporting the Yen?
As the trading week comes to an end, one of the most relevant developments in the FX market has been the renewed strength of the Japanese yen. This can be seen in the recent performance of USD/JPY, which has fallen nearly 1.0% over the last two trading sessions, highlighting a meaningful recovery in the Japanese currency against the U.S. dollar.

Australian Dollar Forecast: AUD/USD Support Reversal Sparks Monthly Range Breakout 10 23 2026
A sharp reversal off key support has fueled the AUD/USD recovery, with resistance now in focus ahead of next week’s Fed decision and Australian CPI.


Crude Oil Forecast: Weekend Iran Strike Fears Lift Oil Toward War Highs
Brent crude oil is accelerating above $110 as traders price in the risk of a US-Israeli strike on Iran over the weekend. How much more of a geopolitical premium can oil build in before the close?

StoneX Europe Ltd may make third party material available on this website which may contain information included but not limited to the conditions of financial markets. The material is for information purposes only and does not contain, and should not be construed as containing, investment advice and/or investment recommendation and/or an investment research and/or an offer of or solicitation for any transactions in financial instruments; any decision to enter into a specific transaction shall be made by the client following an assessment by him/her of their situation.
StoneX Europe Ltd makes no representation or warranty and assumes no liability as to the accuracy or completeness of the information provided, nor any loss arising from any investment based on a recommendation, forecast or other information supplied. You should always seek independent advice as to your suitability to speculate in any related markets and your ability to assume the associated risks, if you are at all unsure. We are not under any obligation to update any such material. Any opinion made may be personal to the author and may not reflect the opinion of StoneX Europe Ltd.