



USD/CAD and USD/MXN 2026 Technical Outlook: Can the Canadian Dollar and Mexican Peso Maintain Their Strength?
USD/CAD shows growing indecision after losing its long-term uptrend, with technical indicators maintaining a bearish bias and key levels pointing to a potential sideways range in early 2026. USD/MXN maintains a strong bearish trend, with the peso firmly in control, though early signs of upward corrections are beginning to emerge.
Share this:

USD/CAD Shows Signs of Indecision
Source: StoneX, Tradingview
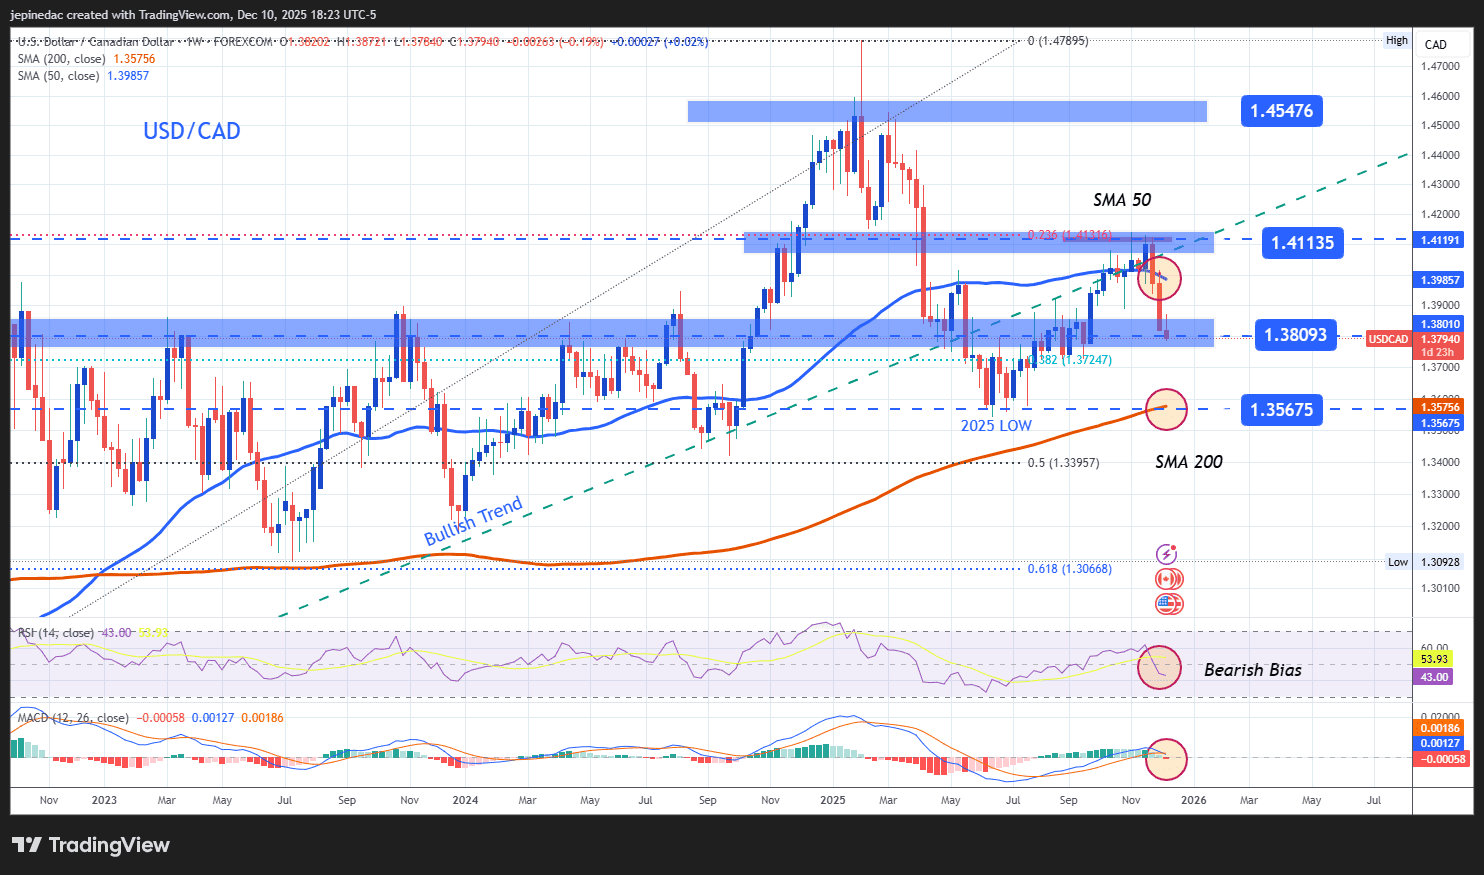
- Long-Term Uptrend Breaks: Since May 2021, USD/CAD had maintained a consistent long-term bullish trend; however, this structure was broken during 2025, giving way to a dominant bearish bias in favor of the Canadian dollar. As a result, attempts by the U.S. dollar to regain strength have been insufficient to reactivate the long-standing uptrend that prevailed for several years. This shift has created a scenario of persistent indecision, where the pair has been unable to establish a clear directional bias in recent months. If buying pressure fails to strengthen, USD/CAD could move into a sideways range during the early months of 2026, especially if buyers cannot recover enough momentum to restore the long-term bullish trend that previously guided the pair.
- Indicators:
- RSI: The RSI continues to oscillate steadily below the neutral 50 level, reflecting that bearish momentum has dominated toward the end of 2025. This indicates a persistent selling bias in USD/CAD based on the indicator’s average behavior. As long as this pattern remains intact, selling pressure is likely to strengthen, reducing the probability of a sustained return to the long-term uptrend seen in previous years.
- MACD: A similar outlook appears in the MACD, whose histogram has crossed below the zero line, signaling that bearish strength has begun to dominate the average of the short-term moving averages. If the histogram continues to record values below zero, selling pressure could become more relevant during the first months of 2026.
- RSI: The RSI continues to oscillate steadily below the neutral 50 level, reflecting that bearish momentum has dominated toward the end of 2025. This indicates a persistent selling bias in USD/CAD based on the indicator’s average behavior. As long as this pattern remains intact, selling pressure is likely to strengthen, reducing the probability of a sustained return to the long-term uptrend seen in previous years.
- Key Levels:
- 1.41135 – Key Resistance: This resistance is located near the 23.6% Fibonacci retracement, considered the most important technical barrier on the chart and positioned above the 50- and 200-period moving averages. A buying breakout above this level could restore a bullish bias and reactivate the long-term uptrend as the dominant technical structure.
- 1.38093 – Current Barrier: This barrier is positioned near the 38.2% Fibonacci retracement and coincides with the most relevant neutrality zone observed over the past three years. If price continues fluctuating around this area, indecision may increase and USD/CAD could form a long-term lateral range.
- 1.35675 – Crucial Support: This support is located at the 200-period simple moving average and aligns with the 2025 lows. A break below this level would signal a structural change in the chart and could confirm the formation of a more consistent long-term downtrend.
- 1.41135 – Key Resistance: This resistance is located near the 23.6% Fibonacci retracement, considered the most important technical barrier on the chart and positioned above the 50- and 200-period moving averages. A buying breakout above this level could restore a bullish bias and reactivate the long-term uptrend as the dominant technical structure.
USD/MXN Maintains Dominant Bearish Bias
Source: StoneX, Tradingview
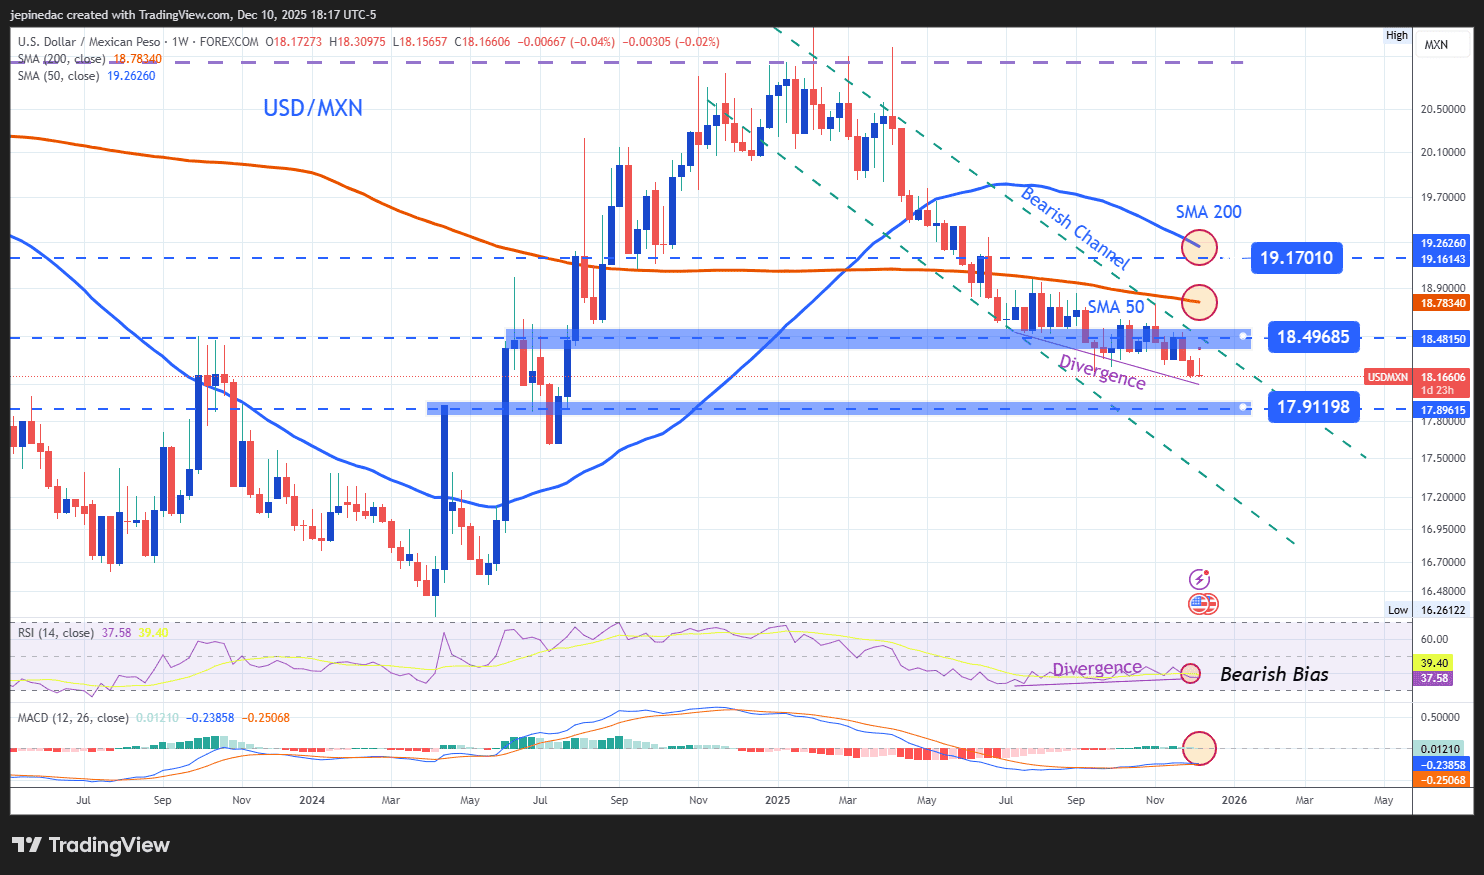
- Downward Channel Holds Firm: Since early January 2025, USD/MXN has traded within a consistent bearish channel, which intensified in April when price movement became more pronounced and began printing progressively lower lows, reflecting the Mexican peso’s dominance over the U.S. dollar. Although several short-term upward corrections have occurred, there is still no buying dominance, confirming that the long-term bearish trend remains the most relevant technical structure and continues to guide the pair’s predominant direction. As long as selling pressure remains steady, the bearish channel is likely to dominate USD/MXN’s behavior in the coming months.
- Indicators:
- RSI: The RSI continues to fluctuate below the neutral 50 level, confirming that bearish momentum has dominated in recent months. However, the indicator has begun forming higher lows, while the price prints lower lows, suggesting a developing bullish divergence. This may indicate an exhaustion of selling pressure, allowing for more consistent upward corrections. Although these corrections do not pose an immediate threat to the broader bearish channel, they may introduce short-term neutrality into the pair’s price action.
- MACD: The MACD histogram remains very close to the zero line, indicating that the average force of short-term moving averages has yet to define a clear directional movement. If this behavior persists, it could signal long-term neutrality, consistent with the potential for short-term bullish corrections within the existing bearish structure.
- RSI: The RSI continues to fluctuate below the neutral 50 level, confirming that bearish momentum has dominated in recent months. However, the indicator has begun forming higher lows, while the price prints lower lows, suggesting a developing bullish divergence. This may indicate an exhaustion of selling pressure, allowing for more consistent upward corrections. Although these corrections do not pose an immediate threat to the broader bearish channel, they may introduce short-term neutrality into the pair’s price action.
- Key Levels:
- 19.17 – Crucial Resistance: This resistance level aligns with the 200-period moving average, making it the key barrier for bullish movements. A breakout above this zone would signal a shift in technical strength, undermining the current steep bearish channel and potentially giving rise to a new long-term buying pressure.
- 18.50 – Nearby Resistance: This level represents a neutrality zone observed in recent months and may act as a recurring barrier against short-term bullish corrections. As long as price remains consistently below this level, the dominant bearish bias is likely to persist over the long term.
- 17.90 – Final Support: This support level corresponds to price territory not seen since July 2024 and serves as the most important barrier for bearish movement. If selling pressure pushes price consistently toward or below this level, the dominant bearish bias could continue, extending the bearish channel through the coming months.
- 19.17 – Crucial Resistance: This resistance level aligns with the 200-period moving average, making it the key barrier for bullish movements. A breakout above this zone would signal a shift in technical strength, undermining the current steep bearish channel and potentially giving rise to a new long-term buying pressure.
Written by Julian Pineda, CFA, CMT – Market Analyst
Follow him at: @julianpineda25



The complete CFD trading experience
Award-winning platforms, competitive spreads, low commissions and dedicated support.
We live and breathe the markets and are dedicated to helping traders realise their ambitions as we continue to set the industry bar.
Economic calendar
Web Trader platform
Our sophisticated web-based platform is packed with features.
Related articles

What Stretched 10-Year Yields Mean for Major Currency Pairs in Q4
U.S. 10-year Treasury yields are nearing a long-term resistance zone with overbought RSI readings, raising near-term pullback risk for the dollar.


USD/CAD shooting star puts September surge on notice
USD/CAD has printed a clear bearish reversal pattern after an extraordinary September surge, but confirmation may depend heavily on how US Treasury yields react to Friday’s payrolls report.


USD/MXN Analysis: Is Super Peso Starting to Fade?
Over recent trading sessions, the Mexican peso has continued to show signs of weakness against the U.S. dollar. This can already be seen in USD/MXN, which has gained more than 1.7% over the last three sessions, highlighting sustained buying pressure in favor of the dollar in the short term.
StoneX Europe Ltd may make third party material available on this website which may contain information included but not limited to the conditions of financial markets. The material is for information purposes only and does not contain, and should not be construed as containing, investment advice and/or investment recommendation and/or an investment research and/or an offer of or solicitation for any transactions in financial instruments; any decision to enter into a specific transaction shall be made by the client following an assessment by him/her of their situation.
StoneX Europe Ltd makes no representation or warranty and assumes no liability as to the accuracy or completeness of the information provided, nor any loss arising from any investment based on a recommendation, forecast or other information supplied. You should always seek independent advice as to your suitability to speculate in any related markets and your ability to assume the associated risks, if you are at all unsure. We are not under any obligation to update any such material. Any opinion made may be personal to the author and may not reflect the opinion of StoneX Europe Ltd.