



USD/CAD Knocked from Its Perch as US Dollar Rally Pauses for Breath
USD/CAD retreats from stretched highs as the US dollar rally cools, with softer yields, Canadian trade strength and crude oil in focus.
Share this:

The US dollar rally has finally lost some momentum after three strong weeks, allowing USD/CAD to retreat from its cycle high. Softer US data, reduced Fed hike bets and easing Treasury yields have weighed on the greenback, while a strong Canadian trade surplus and the prospect of firmer crude oil add to the case for a near-term USD/CAD pullback.
View related analysis:
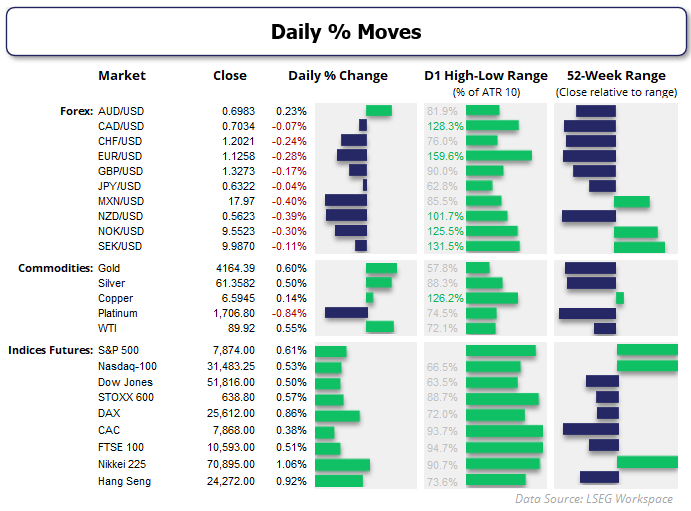
USD/CAD Retreats as the US Dollar Rally Loses Momentum
A weak payrolls report and slightly softer headline ISM services print helped the US dollar index retreat further from Monday’s cycle high, as Fed hike bets were scaled back. The bond-market selloff also stabilised to pull Treasury yields a touch lower, though they remain firmly elevated. Trade data showed imports surged 4.3% to a record $420.8 billion, widening the deficit to $105.6 billion and building the case for weaker growth.
A firmer euro also contributed to US dollar weakness, with bets of an ECB hike in December rising to 80%. French bond yields also pulled back from their highs as bond-market stress eased.
The weaker US dollar helped USD/CAD pull back from arguably stretched highs, aided by an unexpectedly strong Canadian trade surplus. Commodity FX was higher in general, with NZD/USD the strongest FX major and AUD/USD rising for a third day, in line with my near-term bias. It seems markets are taking advantage of the minor reprieve from the US dollar rally, while risk appetite on Wall Street amid earnings optimism also helped.
US Dollar Index (DXY) Technical Analysis
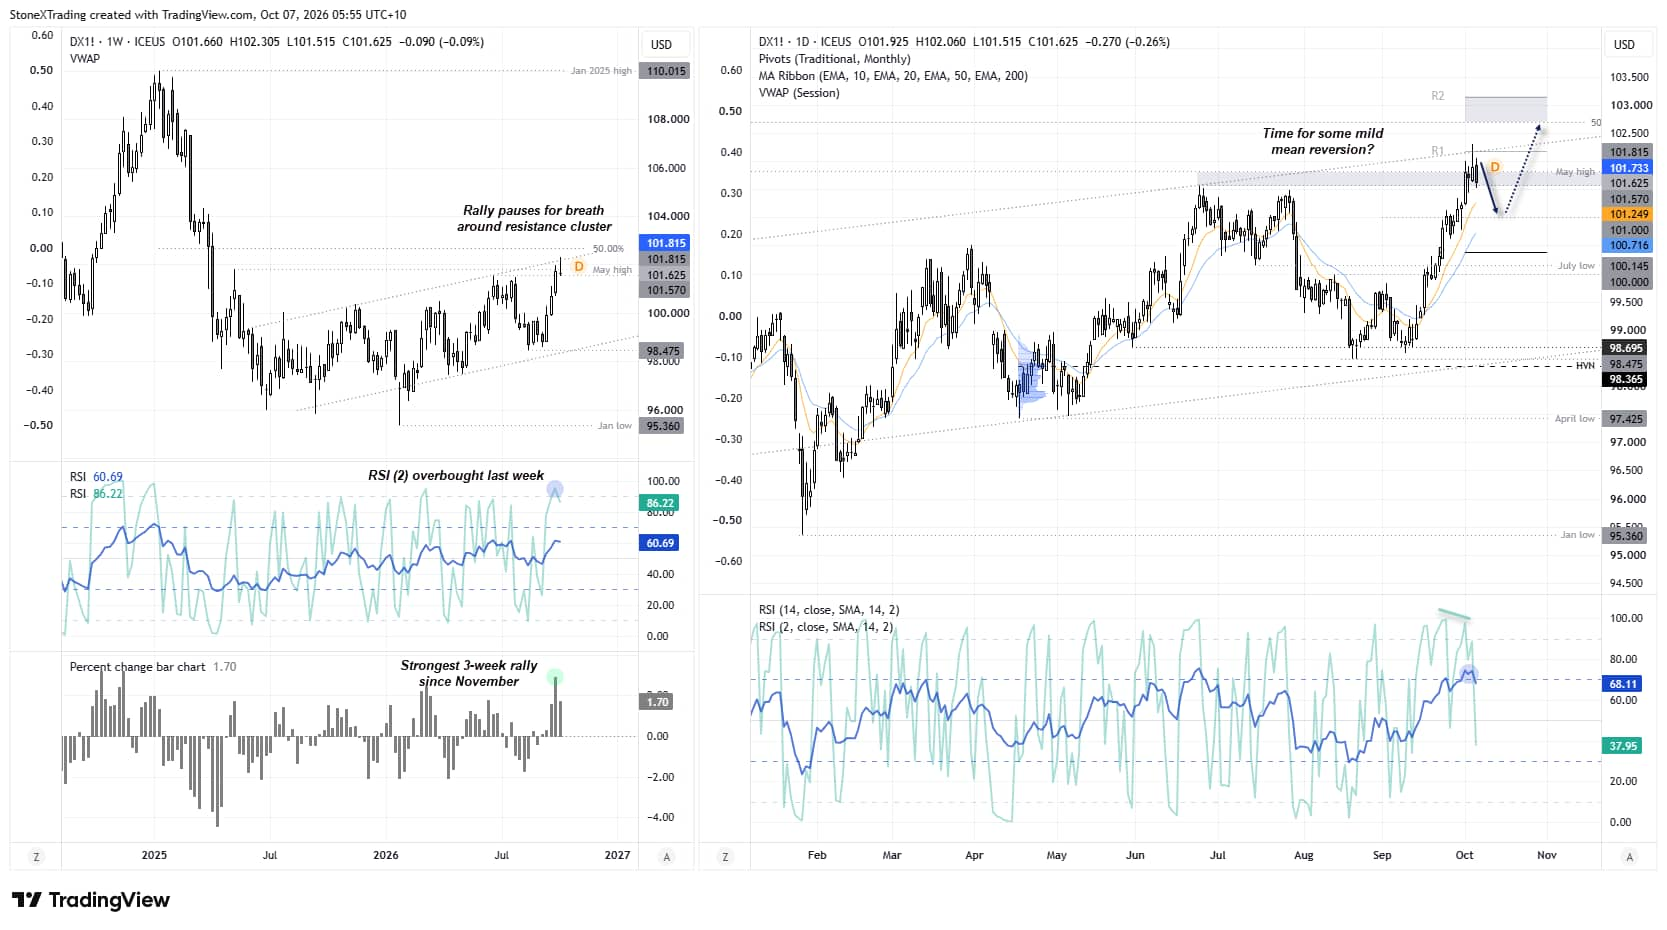
We have just witnessed the strongest three-week rally for the US dollar index since November, but with resistance on hand, a pause in the trend – if not a pullback – is arguably due. The fact that payrolls undermined the rally strengthens the case for momentum to lose steam over the near term.
DXY Weekly Chart Points to a Pause
We’re not even halfway through the week, but DXY is on track for a bearish pinbar should it close around current levels or lower by Friday. Note that prices are back below the May high, while this week’s high has so far respected the upper trend-channel resistance and has not yet managed to test the 50% retracement level between the January 2025 high and January 2026 low. The weekly RSI (2) was also heavily overbought last week.
The daily chart shows a small bearish engulfing candle formed on Tuesday, following a wide-bodied shooting star on Monday. A bearish divergence also formed on the daily RSI (2) within the overbought zone, while RSI (14) is now curling lower from its own overbought zone.
US Dollar Pullback Could Remain Shallow
None of this points to a sharp pullback at this stage, and we should keep in mind the strength of the three-week rally that took us to these levels. But with a lack of top-tier data aside from the FOMC minutes, we could now find volatility across FX majors remains on the lower side while a shallow pullback plays out on DXY.
Source: ICE, TradingView
USD/CAD Technical Analysis: US Dollar vs Canadian Dollar
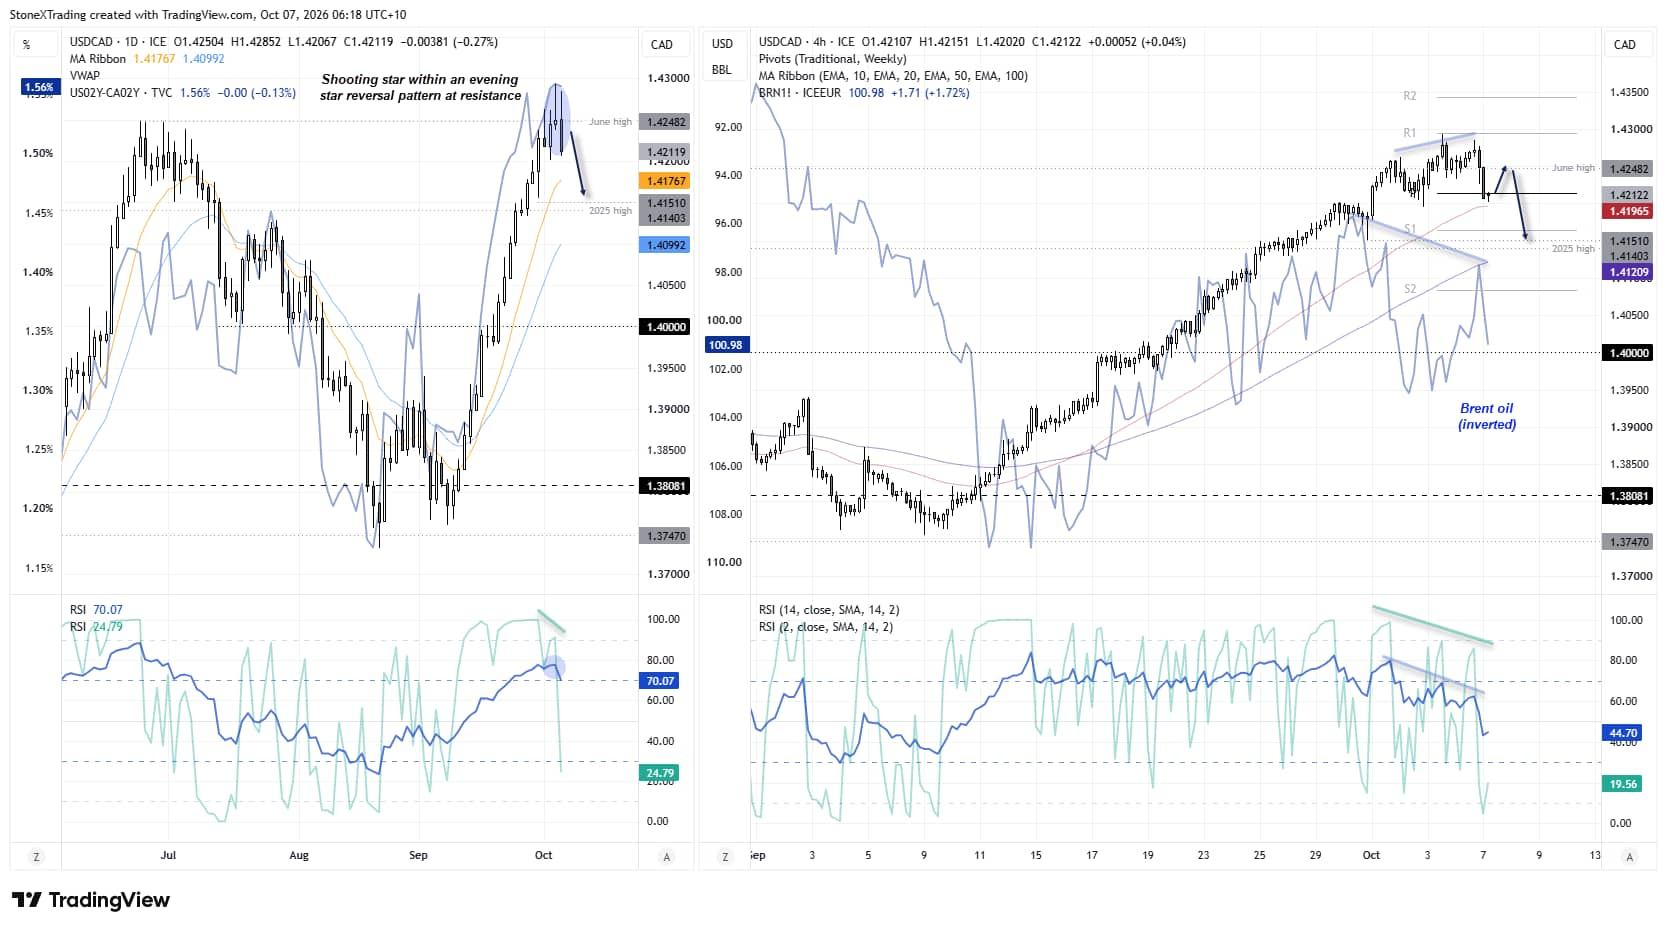
Widening yield differentials between the US and Canada helped USD/CAD enjoy its best three-week rally since December 2024. With the US-Canada 2-year spread remaining pinned near cycle highs, I am not on guard for a deep pullback on USD/CAD.
But given the rally has stalled around the June high, with a shooting star candle followed by bearish range expansion, perhaps a pullback to the 10-day EMA at a minimum is due. And like the US dollar index, the daily RSI (2) on USD/CAD formed a bearish divergence within its overbought zone, while RSI (14) is curling lower from its own overbought zone.

Crude Oil Bounce Could Deepen the USD/CAD Pullback
The 4-hour chart shows support has been found around its 50-bar EMA and weekly pivot point, while RSI (2) is heavily oversold. Perhaps bears may be seeking to fade into moves towards the June high and maintain a near-term bearish bias while USD/CAD remains beneath Monday’s high.
Note the Brent futures chart I have overlaid is inverted, as it tends to correlate positively with USD/CAD. So if oil prices bounce – which I have a hunch they may – it could build the case for a slightly deeper pullback in USD/CAD over the near term.
Source: ICE, TradingView
Related tags:
Latest market news




The complete CFD trading experience
Award-winning platforms, competitive spreads, low commissions and dedicated support.
We live and breathe the markets and are dedicated to helping traders realise their ambitions as we continue to set the industry bar.
Economic calendar
Web Trader platform
Our sophisticated web-based platform is packed with features.
Related articles
Silver's bullish breakout case builds as bond yields retreat
The Democratic blue wave has sent crude and Treasury yields sharply lower, improving the outlook for precious metals. With gold already breaking higher, could silver be next?
Swiss Franc Short-term Outlook: USD/CHF Selloff Nears Critical Support Ahead of NFP 11 4 2026
USD/CHF bears are closing in on critical trend support, with the next reaction likely to determine whether the October decline has further to run.

USD/CAD Forecast: Canadian Dollar Gains Ground After U.S. Midterm Elections
The trading week continues to unfold and the recovery in the Canadian dollar has once again become a relevant theme in the short term. This can be clearly seen in the recent performance of USD/CAD, which is down nearly 0.4% during the session, reflecting a consistent recovery in the CAD against the U.S. dollar.

StoneX Europe Ltd may make third party material available on this website which may contain information included but not limited to the conditions of financial markets. The material is for information purposes only and does not contain, and should not be construed as containing, investment advice and/or investment recommendation and/or an investment research and/or an offer of or solicitation for any transactions in financial instruments; any decision to enter into a specific transaction shall be made by the client following an assessment by him/her of their situation.
StoneX Europe Ltd makes no representation or warranty and assumes no liability as to the accuracy or completeness of the information provided, nor any loss arising from any investment based on a recommendation, forecast or other information supplied. You should always seek independent advice as to your suitability to speculate in any related markets and your ability to assume the associated risks, if you are at all unsure. We are not under any obligation to update any such material. Any opinion made may be personal to the author and may not reflect the opinion of StoneX Europe Ltd.