



USD/JPY Ascending Triangle, but is 160 Vulnerable?
USD/JPY continues to catch bids after pullbacks with today showing another example following last week’s pullback to 157.50. This keeps in-line an ascending triangle formation.
Share this:

USD/JPY Talking Points:
- USD/JPY volatility has quieted over the past month following the steep sell-off from the 160.00 handle.
- Since then, 159.00 has functioned as resistance but bulls haven’t been too deterred, continually showing up after pullbacks at higher-lows.
- This sets the stage for tension, with that 159 level as resistance and the 160 level the bigger spot sitting overhead.
While the FX fireworks have been elsewhere of late, USD/JPY remains structurally clean, and as I looked at in last week’s webinar I think the pair is one of the more attractive backdrops for items of USD-strength. That said, the market is not without its own drama as the 160.00 level that evoked comments from both Katayama in Japan and Bessent in the US sits just above current resistance at the 159.00 handle.
That 159.00 level had a bit of verbal defense, as well, but the reaction to that wasn’t nearly as stark as what had showed a month earlier when USD/JPY fell by more than 700 pips after venturing above the 160.00 handle. And, of course, the 164.00 level looms large as this was the spot that was actually defended by a real intervention, rather than just threats like the 160 and then 159 levels.
But perhaps more to the point, talk is cheap, and fundamentals remain tilted to the long side of the pair as US inflation is higher than that of Japan and even with the BoJ talking up rate hikes, the Fed has a harder road ahead given that expectation for continued high inflation.
This is why, despite the best efforts from economic policymakers on both sides of the pair, USD/JPY has tended towards bullish structure, such as we see today. From the daily chart you can see multiple underside wicks, each reflecting a response from buyers to pullbacks. We had one such scenario last Thursday, with bulls responding just above the 157.50 level, and that gave a higher-low on Friday and, again, this Monday.
USD/JPY Daily Chart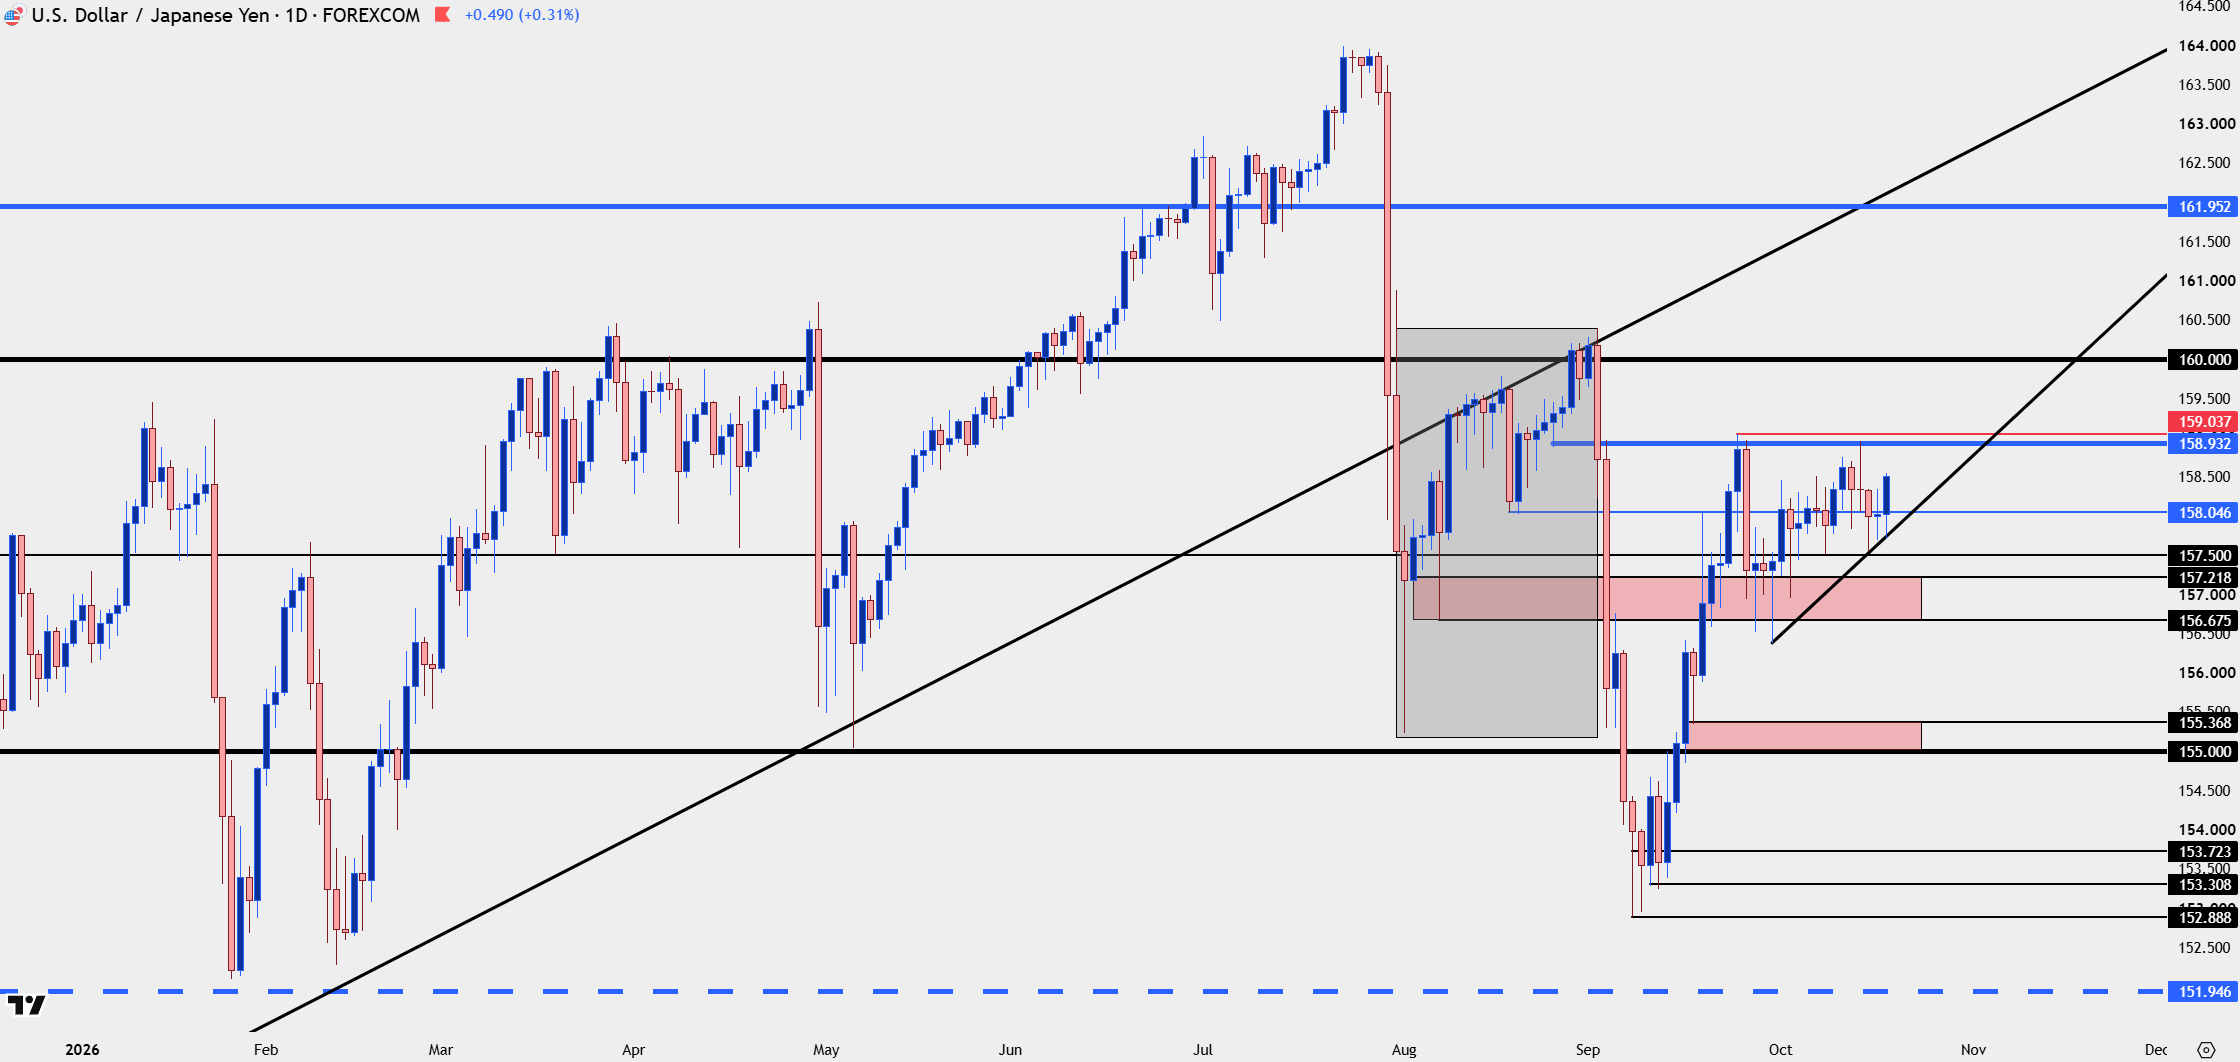
Chart prepared by James Stanley; data derived from Tradingview
USD/JPY Longer-Term
At this point we’ve seen action at 164 but only posturing below, and given how long buyers have hung around, this could spell for an eventual test until some type of action takes place from policymakers. I’d still be careful chasing breakouts over the 160 handle, but at this stage, pullbacks and a push up to 159 could remain attractive, given that buyers have shown up in the manner that they have.
If a breakout at 160 happens, price can move fast, because there’s likely a litany of stops sitting above the big figure, and if those stops get triggered that’s a wave of demand that can create a fast move-higher. This would be similar to the April of 2024 episode, when the 151.95 level was finally broken, after which we had a direct run up to the 160.00 level.
USD/JPY Weekly Chart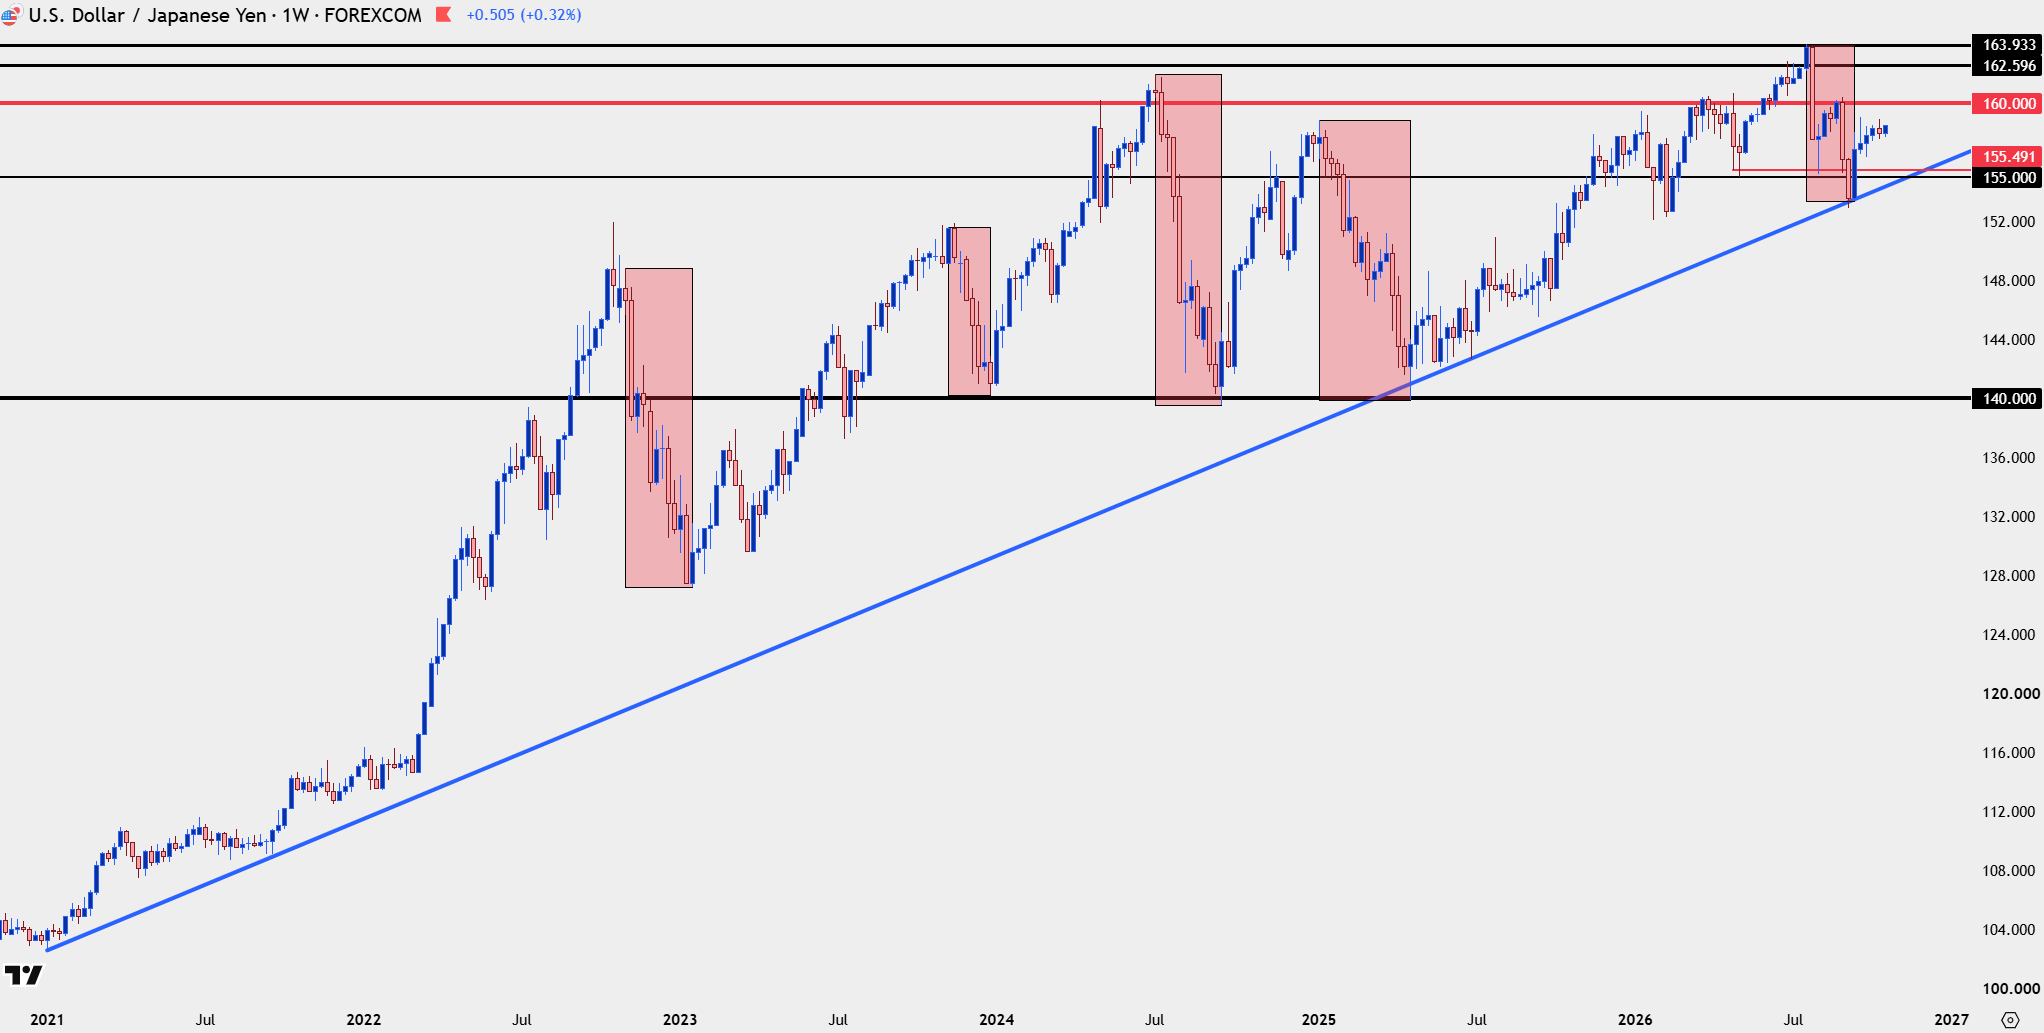
Chart prepared by James Stanley; data derived from Tradingview
--- written by James Stanley, Senior Market Analyst, Global Macro
Related tags:
Latest market news




The complete CFD trading experience
Award-winning platforms, competitive spreads, low commissions and dedicated support.
We live and breathe the markets and are dedicated to helping traders realise their ambitions as we continue to set the industry bar.
Economic calendar
Web Trader platform
Our sophisticated web-based platform is packed with features.
Related articles
USD/JPY Ascending Triangle, but is 160 Vulnerable?
USD/JPY continues to catch bids after pullbacks with today showing another example following last week’s pullback to 157.50. This keeps in-line an ascending triangle formation.

Gold Sell-Off Stalls but Can Bulls Force a Turn?
Gold has dropped by as much as 13% from the August highs, and almost 30% from the January highs. More recently, however, bulls have been putting up a fight at the $4100 level that and that’s the item of importance for this week.

S&P 500, Nasdaq, Dow and Russell 2000 For the Week Ahead
Stocks started to shake last week and there was even a hint of this in the prior week. The question now is whether we’re at the point where buyers may abandon pullbacks as get closer to mid-term elections.
StoneX Europe Ltd may make third party material available on this website which may contain information included but not limited to the conditions of financial markets. The material is for information purposes only and does not contain, and should not be construed as containing, investment advice and/or investment recommendation and/or an investment research and/or an offer of or solicitation for any transactions in financial instruments; any decision to enter into a specific transaction shall be made by the client following an assessment by him/her of their situation.
StoneX Europe Ltd makes no representation or warranty and assumes no liability as to the accuracy or completeness of the information provided, nor any loss arising from any investment based on a recommendation, forecast or other information supplied. You should always seek independent advice as to your suitability to speculate in any related markets and your ability to assume the associated risks, if you are at all unsure. We are not under any obligation to update any such material. Any opinion made may be personal to the author and may not reflect the opinion of StoneX Europe Ltd.