


USD/JPY Shrugs Off Softer US Data and Faster BOJ Hike Talk
The yen has been handed several tailwinds over the past week. USD/JPY’s refusal to respond suggests the market may be looking beyond near-term Fed and BOJ pricing.
Share this:

- Softer US data fails to boost Japanese yen
- Earlier BOJ hike talk gains traction
- USD/JPY remains sensitive to Treasury yields
- Higher energy prices may be adding to yen pressure
- Buying dips looks more attractive
Yen Tailwinds Fail to Bite
Much of the chatter over the past week has centred on the downside surprise in US non-farm payrolls, the soft US CPI report and the undershoot in PPI overnight, which has seen Fed rate hike pricing pared over the next year.
At the same time, speculation has intensified that the Bank of Japan could move rates earlier than markets had previously expected, something that, based on the reporting, should be bullish for the yen.
But the price action is not playing ball.
That suggests something more than faster BOJ hikes or softer US data may be required to fundamentally alter the upward trend in USD/JPY.
US Data Momentum Rolls Over
Source: LSEG, FOREX.com
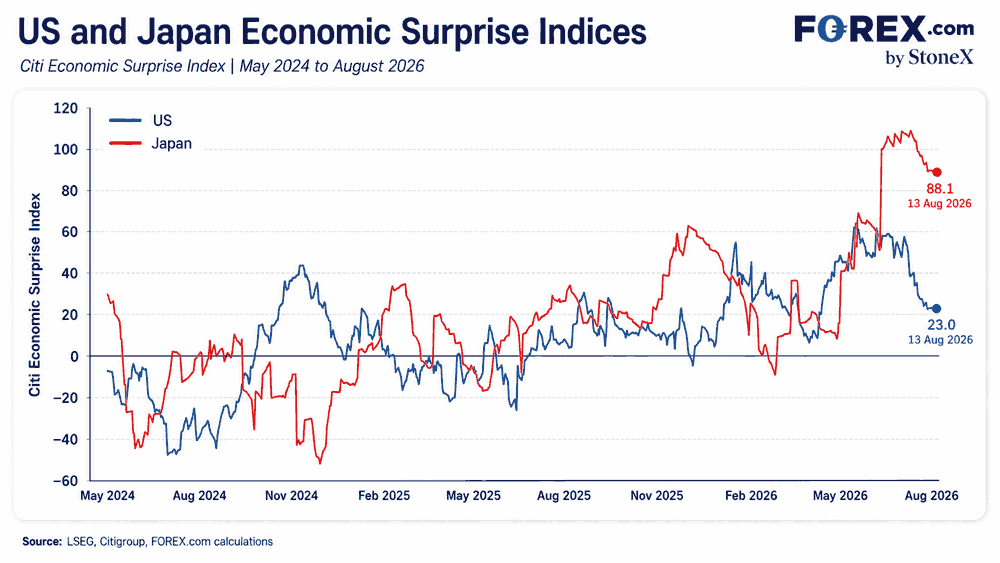
US economic exceptionalism has long been cited as one of the factors behind USD/JPY continuing to push to multi-decade highs. Yet recent trends are starting to question that narrative, with US data surprises, while still positive according to Citi's index, retracing to levels not seen since early May.
At the same time, Japanese data surprises, while not as prevalent as they were a month or so ago, remain by and large positive, particularly against historical norms.
Yet even with the threat of intervention still looming over the yen, that has not been enough to move the dial. Nor has the sharp decline in Fed hike pricing provided much of a headwind for USD/JPY.
Markets Pare Fed Path
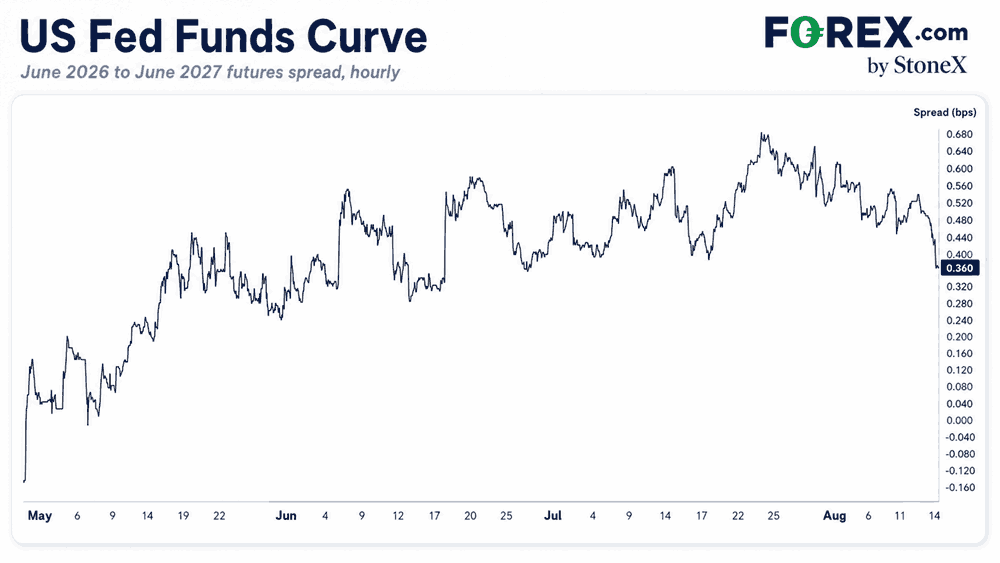
As seen in the graphic below, market pricing for Fed hikes out to the June meeting next year has retraced substantially over the past few weeks, falling from more than 64 basis points of tightening in late July to just 36 basis points following a soft run of key US economic data, including payrolls, CPI and PPI over the past week.
Source: TradingView, FOREX.com
BOJ Needs to Out-Hawk the Curve
In what was an otherwise light session for macro news on Thursday, one of the stories that got plenty of attention was a Bloomberg report suggesting the Japanese government was becoming more comfortable with the Bank of Japan hiking interest rates sooner.
Citing people familiar with the matter, Bloomberg said the government would be supportive of an earlier move, with September or October seen as the most likely timing. It also suggested the government and BOJ were increasingly aligned on the need to combat yen weakness, alluding to the potential for an earlier hike to reinforce the impact of the joint US-Japan intervention that took place in late July.
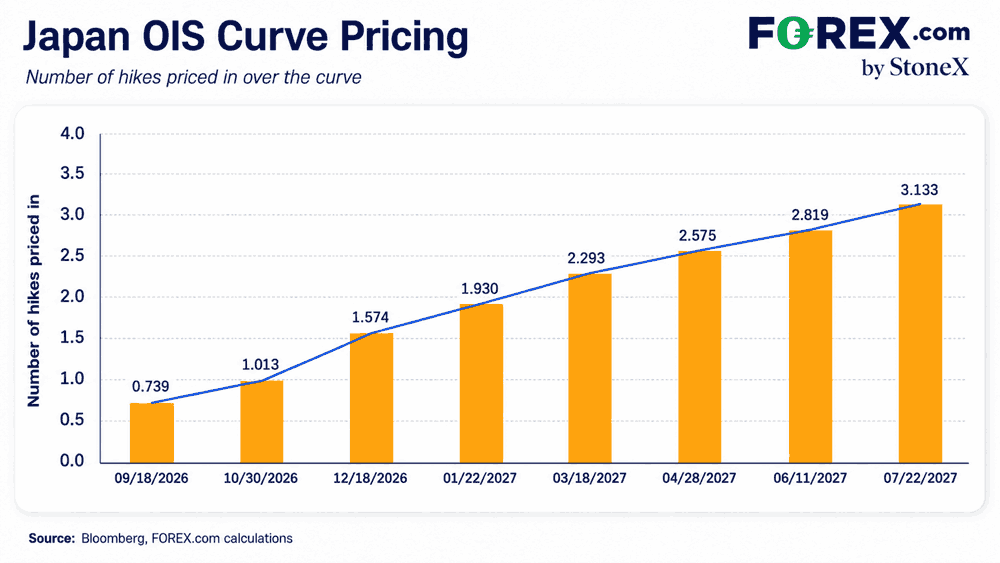
But that assessment is clearly from someone who has likely not spent a lot of time in markets, because the timing matters little if the amount of tightening being priced does not change materially. As seen in the graphic below, markets already have around 74% of a hike priced for September, a full move by October and more than three hikes priced into the curve by the middle of next year.
Source: Bloomberg, FOREX.com
It is not a given by any stretch. But if the aim is to get markets more positive on the yen and take some pressure off the back end of the JGB curve from concerns about allowing inflation to remain well above target, as has been the case for lengthy periods in recent years once government subsidies are excluded, the BOJ probably needs to out-hawk the market.
That means signalling not only a faster pace of hikes, but more tightening overall than what is already priced in. Simply bringing the next move forward may not cut the mustard.
Shifting Drivers
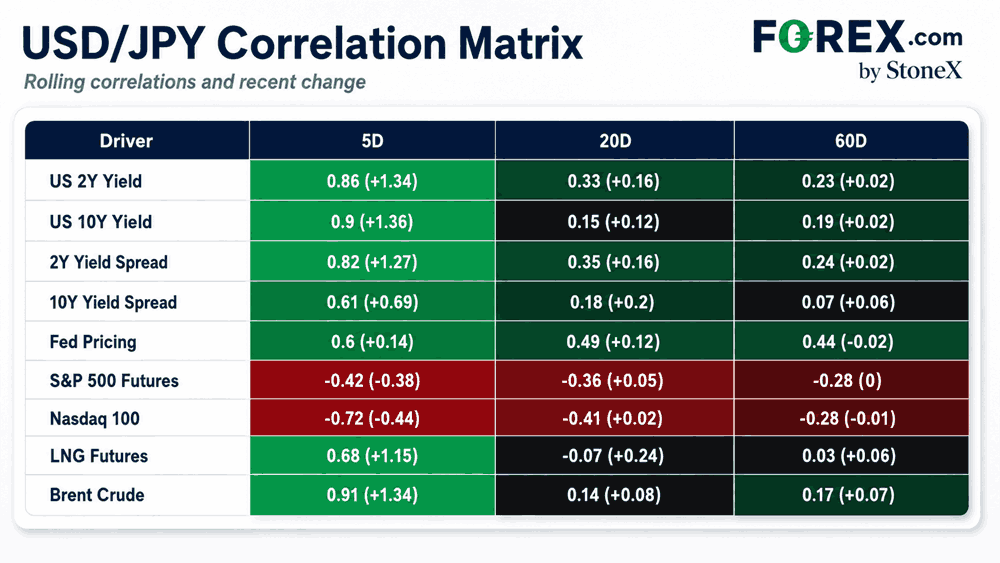
The message from the correlation matrix is interesting. While it needs to be treated with some caution due to the very short time frame, USD/JPY is showing a very strong positive relationship with both short and longer-dated US Treasury yields over the past week, with slightly weaker relationships with yield spreads between the US and Japan. The relationship with Fed pricing also remains moderately strong.
Source: TradingView, FOREX.com
There is also a very strong relationship with energy prices, particularly Brent, suggesting geopolitics and Japan's greater vulnerability to higher energy costs relative to the United States may also be in play.
But the matrix only measures directional relationships on a closing basis. When you look at the actual reaction to moves in yields and spreads, what stands out is USD/JPY has been far more sensitive to upticks than downticks. Higher US yields and wider spreads have generated a much stronger response than comparable declines.
With the pair negatively correlated with US equity futures over the same short window, broader risk appetite does not appear to be playing a particularly large role either. Given how strong the relationships are with US yields and yield spreads, it suggests that, at least for now, the Japanese rate outlook is not a key driver.
That makes stories like the one we saw on Thursday a little redundant unless they materially alter the amount of tightening markets expect from the BOJ.
Intervention Pattern Starts to Repeat
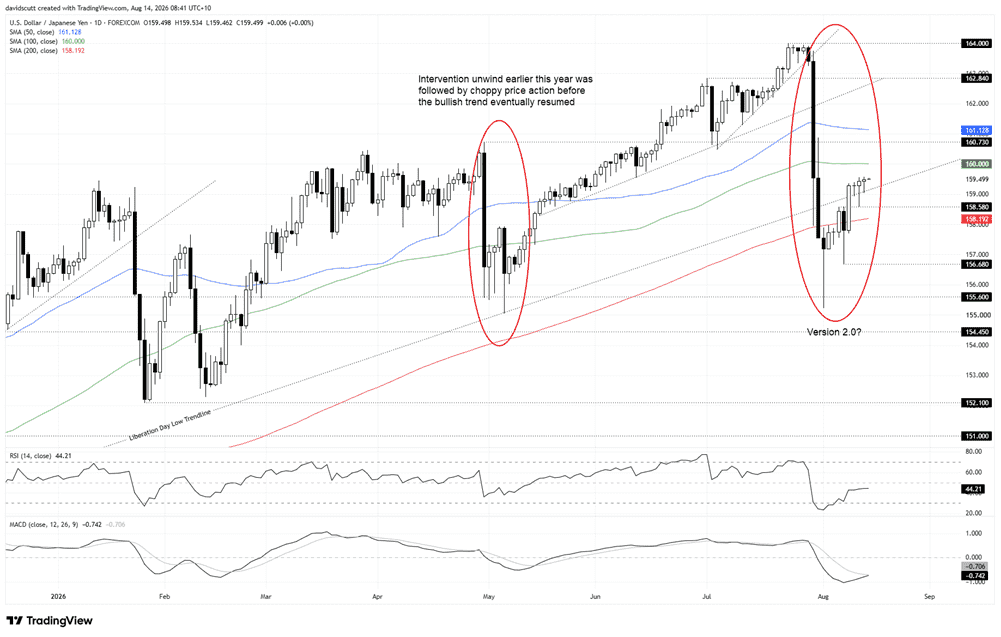
Source: TradingView
Looking at USD/JPY on the daily chart, what stands out immediately is how eerily similar the price action has been to the prior intervention episode in late April and May. Initial choppiness has once again been followed by a continued grind higher, even though the United States was also involved this time.
What is also interesting is that the pair continues to respect the Liberation Day uptrend stemming back to April last year, with bounces from that level in two of the past three sessions. Since the trend line was established, it has held firm on numerous occasions, including through the intervention episode in April and May, making it the immediate downside level of note. 158.58 is another level that has acted as both support and resistance over the past fortnight, marking the bottom of a support zone underneath where the pair now trades.
Overhead, as flagged previously, the 100-day simple moving average remains an obvious upside target for bulls. Above that, 160.73, the former multi-decade high set earlier this year, is the next level of note.
Below 158.58, the 200-day moving average is an important downside level, along with 156.68 where the pair bottomed on August 7. Break beneath that and the risk is we may see a retest of the intervention episode lows.
Given the buoyancy of the price action, buying dips still comes across as the preferred strategy in the near term, targeting the 100-day simple moving average.
While I’m putting less weight on the message from the oscillators given the distortion created by the intervention episode, even there the picture is becoming less bearish. RSI (14) has recovered and is moving back towards the neutral 50 level, while MACD is close to delivering a bullish crossover of the signal line.
At the very least, it suggests downside momentum artificially generated by the intervention episode is diminishing, and diminishing quickly. While the overall technical picture is still more neutral than bullish, buying dips remains preferable to selling into strength.
Latest market news




The complete CFD trading experience
Award-winning platforms, competitive spreads, low commissions and dedicated support.
We live and breathe the markets and are dedicated to helping traders realise their ambitions as we continue to set the industry bar.
Economic calendar
Web Trader platform
Our sophisticated web-based platform is packed with features.
Related articles
USD/CAD reversal risk builds as central bank showdown looms
USD/CAD has delivered a bullish reversal signal from established support, just as traders prepare for Fed and BoC decisions. Aggressive Canadian rate hike expectations and conflicting momentum signals make the coming session important.
EUR/USD weekly outlook: FOMC and ECB to set the tone
The current backdrop is modestly bearish. On Friday, the EUR/USD closed modestly lower, down for the third consecutive day. The pair also posted a weekly decline after staging a modest recovery attempt in the previous week. Out of the past 8 weeks, the EUR/USD has fallen on 6 occasions. There is not much supporting factors for the single currency right now. So, the upside remains capped.

S&P 500, Nasdaq, Dow Forecast: Nasdaq Selloff Deepens as Dow Rally Stalls 10 24 2026
A failed S&P breakout and looming Nasdaq support test raise the stakes for next week’s Fed decision and October’s monthly close.

StoneX Europe Ltd may make third party material available on this website which may contain information included but not limited to the conditions of financial markets. The material is for information purposes only and does not contain, and should not be construed as containing, investment advice and/or investment recommendation and/or an investment research and/or an offer of or solicitation for any transactions in financial instruments; any decision to enter into a specific transaction shall be made by the client following an assessment by him/her of their situation.
StoneX Europe Ltd makes no representation or warranty and assumes no liability as to the accuracy or completeness of the information provided, nor any loss arising from any investment based on a recommendation, forecast or other information supplied. You should always seek independent advice as to your suitability to speculate in any related markets and your ability to assume the associated risks, if you are at all unsure. We are not under any obligation to update any such material. Any opinion made may be personal to the author and may not reflect the opinion of StoneX Europe Ltd.