





USDJPY 11160 and the Battle to be King of the FX Safe Havens
At times like this, traders may want to shorten their time horizon and focus on key levels on shorter-term charts...
Share this:

With risk assets surging higher for the second straight day, two of the safe haven currencies are getting left in the dust. FX traders piled in to buy the US dollar and Japanese yen aggressively in recent weeks as they unwound carry trades and sought a safe place to store capital, but now that tide is going out (or at least the latest “wave” of the flow is receding). While the market’s broader risk appetite has interesting implications for various pairs, we wanted to focus in on a key level that may determine which safe haven currency is king in the days to come.
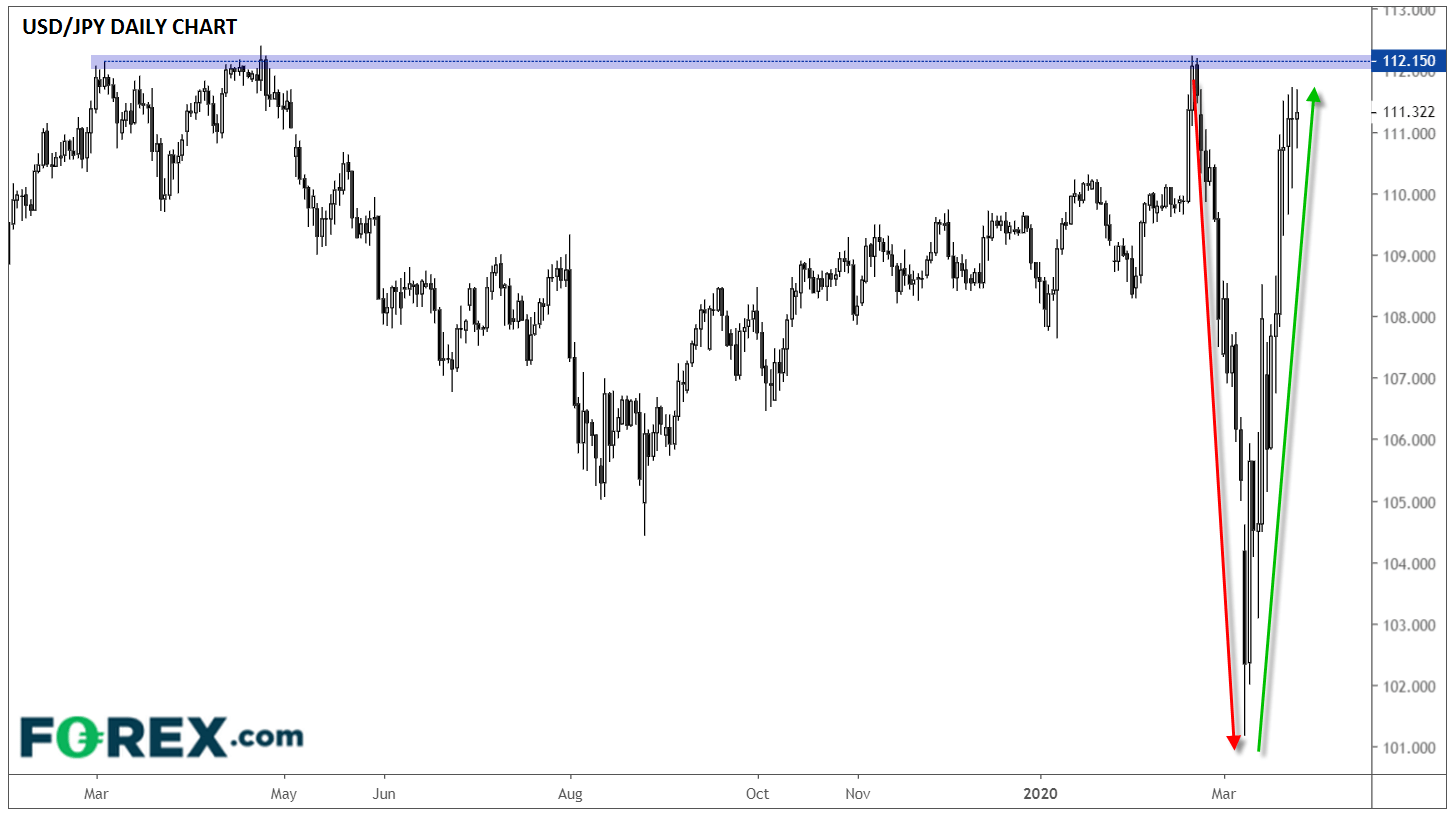
Looking at USD/JPY, rates have seen a violent round trip after peaking near 112.00 in late February, collapsing all the way to near 101.00 by early March, and then rising from the ashes to tack on over 1,000 pips to trade back in the mid-111.00s as of writing:
Source: TradingView, GAIN Capital
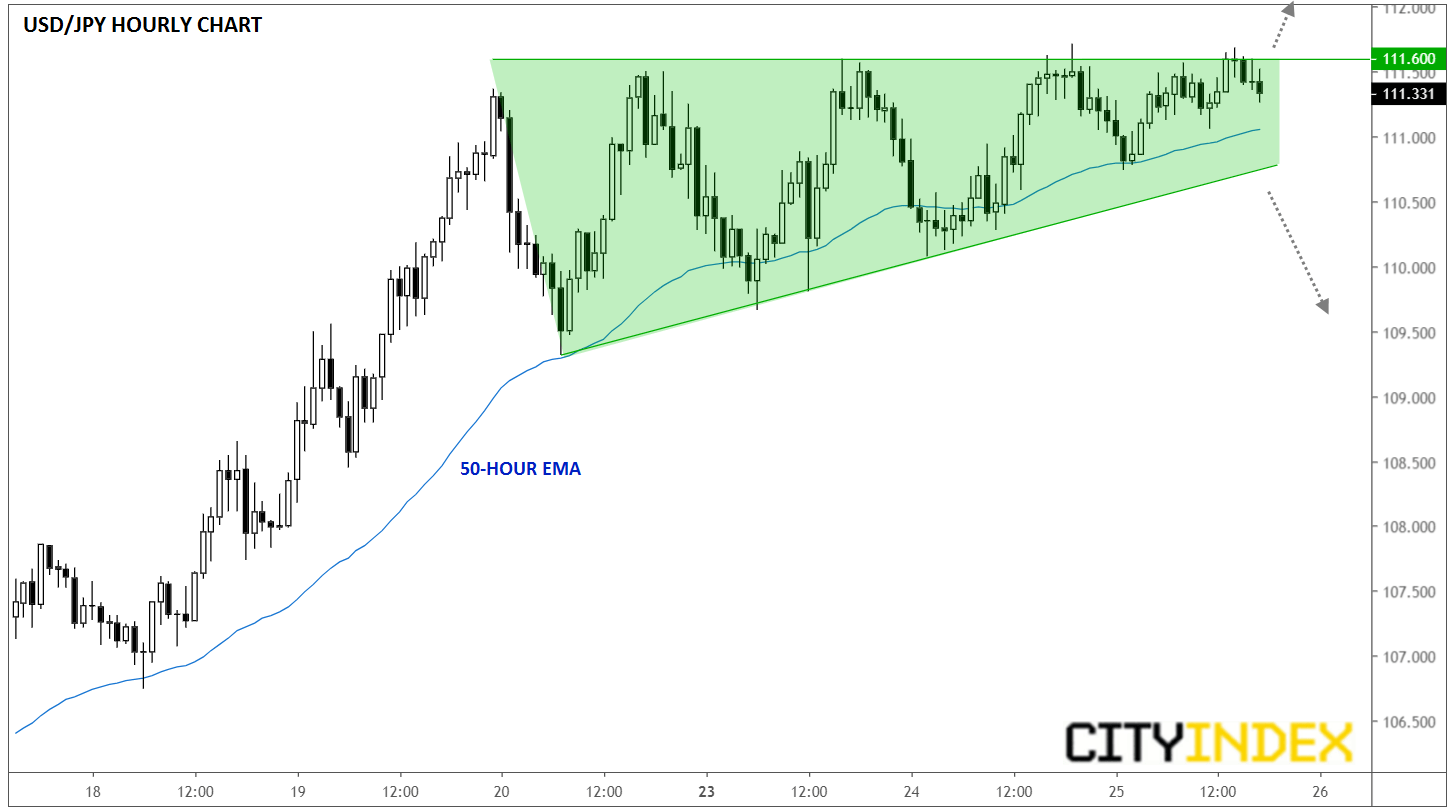
As the daily chart above shows, the massive drop and reversal has little historical precedent and has thrown the longer-term trend into question. At times like this, traders may want to shorten their time horizon and focus on key levels on shorter-term charts. As the hourly chart below shows, USD/JPY is forming a clear ascending triangle pattern on the hourly chart, with the pair testing established resistance at 111.60 while putting in progressively higher lows over the last four days:
Source: TradingView, GAIN Capital
Generally speaking, ascending triangle patterns indicate growing buying pressure that most often leads to a bullish breakout and continuation higher, though as we approach month- and quarter-end rebalancing after one of the most volatile months in recent memory, all FX pairs may see less predictable moves. Nonetheless, a break above 111.60 (ideally confirmed by a daily close above that area) would be a bullish sign that could reaffirm the US dollar as the “Safe Haven King” of the FX market. Meanwhile, a break lower from the current ascending triangle pattern could be the first step toward a swing back toward the yen being the most in-demand currency on the market’s next bout of risk aversion.
With risk assets surging higher for the second straight day, two of the safe haven currencies are getting left in the dust. FX traders piled in to buy the US dollar and Japanese yen aggressively in recent weeks as they unwound carry trades and sought a safe place to store capital, but now that tide is going out (or at least the latest “wave” of the flow is receding). While the market’s broader risk appetite has interesting implications for various pairs, we wanted to focus in on a key level that may determine which safe haven currency is king in the days to come.
Looking at USD/JPY, rates have seen a violent round trip after peaking near 112.00 in late February, collapsing all the way to near 101.00 by early March, and then rising from the ashes to tack on over 1,000 pips to trade back in the mid-111.00s as of writing:
Source: TradingView, GAIN Capital
As the daily chart above shows, the massive drop and reversal has little historical precedent and has thrown the longer-term trend into question. At times like this, traders may want to shorten their time horizon and focus on key levels on shorter-term charts. As the hourly chart below shows, USD/JPY is forming a clear ascending triangle pattern on the hourly chart, with the pair testing established resistance at 111.60 while putting in progressively higher lows over the last four days:
Source: TradingView, GAIN Capital
Generally speaking, ascending triangle patterns indicate growing buying pressure that most often leads to a bullish breakout and continuation higher, though as we approach month- and quarter-end rebalancing after one of the most volatile months in recent memory, all FX pairs may see less predictable moves. Nonetheless, a break above 111.60 (ideally confirmed by a daily close above that area) would be a bullish sign that could reaffirm the US dollar as the “Safe Haven King” of the FX market. Meanwhile, a break lower from the current ascending triangle pattern could be the first step toward a swing back toward the yen being the most in-demand currency on the market’s next bout of risk aversion.




The complete CFD trading experience
Award-winning platforms, competitive spreads, low commissions and dedicated support.
We live and breathe the markets and are dedicated to helping traders realise their ambitions as we continue to set the industry bar.
Economic calendar
Web Trader platform
Our sophisticated web-based platform is packed with features.
Related articles

EUR/USD Forecast: Euro Extends Losses Ahead of Fed Rate Decision
The euro has started to face a more challenging period in the short term. The EUR/USD pair has already declined by nearly 0.81% over the last four trading sessions, a move that has begun to reinforce a meaningful bearish bias in favor of the U.S. dollar.


Gold, Silver, DXY Outlook: Charts Test Defining Support Levels
Gold, Silver, DXY Outlook: Charts test defining support levels as crude oil prices hold above $100, U.S. Treasury yields move higher and hawkish FOMC risks come into focus. Key scenarios to watch.


Dow Jones Forecast: DJIA tumbles as Oil hits $100
U.S. stocks are pointing to a lower open as oil prices breach $100 a barrel for the first time since July, amid deepening tensions in the Middle East. Investors also remain cautious ahead of inflation data later in the week.

StoneX Europe Ltd may make third party material available on this website which may contain information included but not limited to the conditions of financial markets. The material is for information purposes only and does not contain, and should not be construed as containing, investment advice and/or investment recommendation and/or an investment research and/or an offer of or solicitation for any transactions in financial instruments; any decision to enter into a specific transaction shall be made by the client following an assessment by him/her of their situation.
StoneX Europe Ltd makes no representation or warranty and assumes no liability as to the accuracy or completeness of the information provided, nor any loss arising from any investment based on a recommendation, forecast or other information supplied. You should always seek independent advice as to your suitability to speculate in any related markets and your ability to assume the associated risks, if you are at all unsure. We are not under any obligation to update any such material. Any opinion made may be personal to the author and may not reflect the opinion of StoneX Europe Ltd.