






USD/JPY Analysis: The Yen Strengthens After the NFP Report
Today, the Japanese yen appreciated by nearly 1% against the U.S. dollar, introducing a notable bearish bias in the current movements of the USD/JPY pair.
Share this:

Today, the Japanese yen appreciated by nearly 1% against the U.S. dollar, introducing a notable bearish bias in the current movements of the USD/JPY pair. The release of the Non-Farm Payroll (NFP) report increased short-term volatility, and for now, it has repositioned the yen against the dollar as investors digest the data.
NFP Day Has Arrived
The U.S. employment report surprised markets with the creation of 177,000 new jobs, significantly above the 138,000 expected. However, the figure remains below the 185,000 reported in April, which was revised downward.
Markets reacted quickly—despite being above expectations, the report reinforces the downward trend in job creation seen over the past year. Although positive on the surface, investors appear to interpret the data as a sign of a gradual economic slowdown, rather than consistent acceleration. This could reduce expectations for the Federal Reserve (FED) to maintain high interest rates in future decisions. Additionally, the recent trade war has impacted market confidence in the U.S., and the sharp downward revision to the previous NFP further supports the idea of a steady slowdown in job growth.
Source: Forex Factory
Currently, the CME Group’s FedWatch Tool indicates a 98.7% probability that the Fed will maintain its rate in the 4.25%–4.5% range at its upcoming meeting on May 7. However, the outlook for the June 18 decision has started to shift, now showing just a 58.8% chance of maintaining the current range and a 39.8% chance of a rate cut to 4.00%–4.25%.
Source: CME Group

Source: CME Group
Meanwhile, in its latest meeting, the Bank of Japan (BoJ) decided to keep its interest rate at 0.25%. While some comments have hinted at a potential policy shift, the BoJ has stated that it will continue monitoring the domestic economy before confirming any changes. For now, no additional rate reductions are being considered.
In this context, the new U.S. employment data has led to increased short-term volatility against the dollar, as the labor market trend remains bearish. If this trend continues, the probability of rate cuts by the FED could rise, potentially weakening demand for U.S. dollars. Additionally, if the Bank of Japan maintains a stable monetary policy, this could increase demand for the yen in the coming weeks, further weakening the dollar and intensifying selling pressure on USD/JPY.
Market Sentiment
The Fear and Greed Index from CNN currently stands at 42 points, placing it still within the "fear" zone and reflecting that market uncertainty persists, with investors remaining cautious.
Source: CNN
In this environment, it's important to remember that the Japanese yen continues to be considered a safe-haven asset, and while confidence remains low, some investors may prefer the yen to protect capital in the short term. If these conditions persist, selling pressure on USD/JPY could intensify.
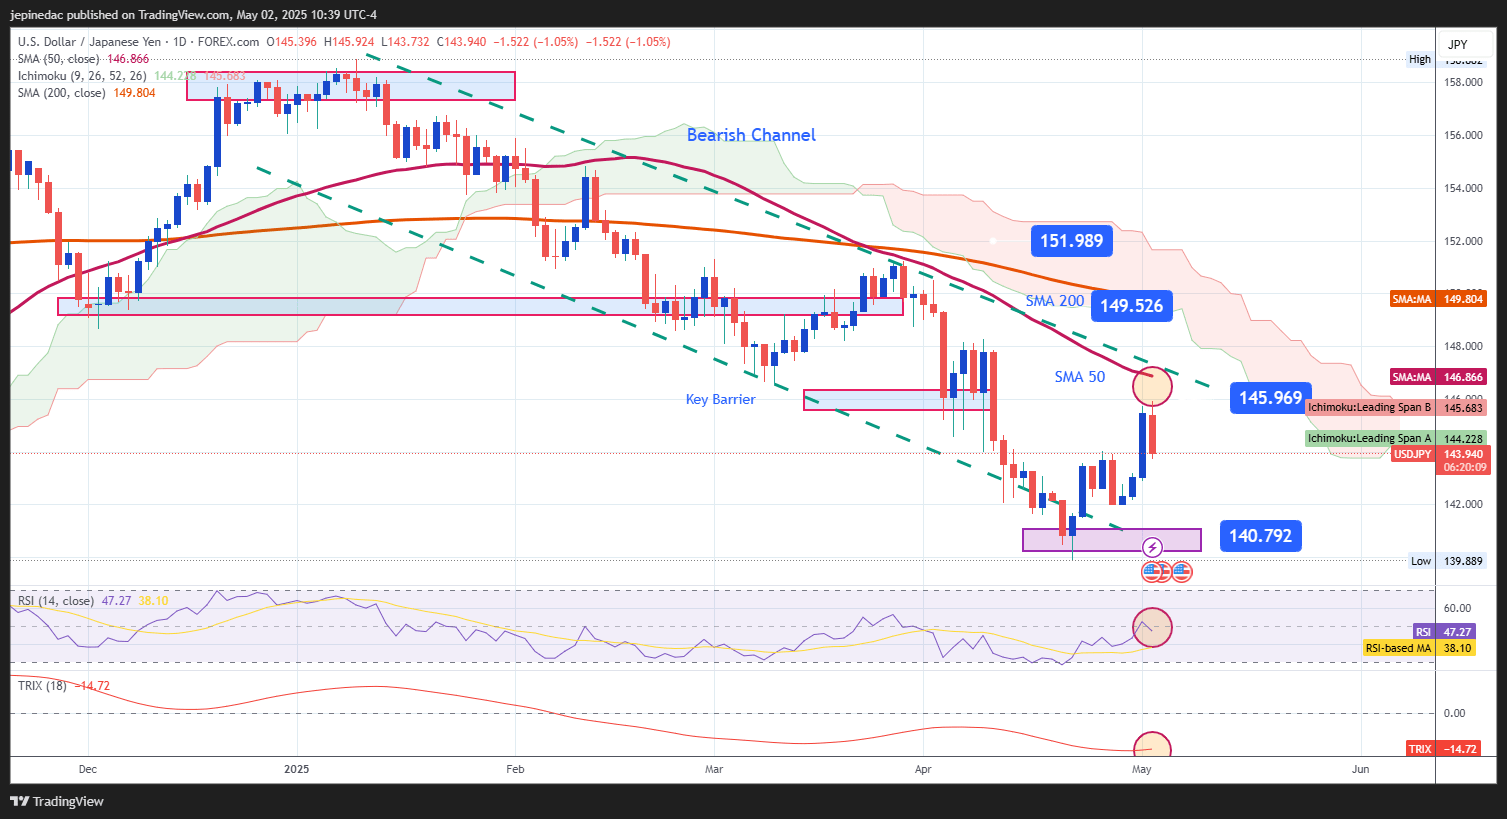
USD/JPY Technical Outlook
Source: StoneX, Tradingview
- Ongoing Bearish Channel: Since January 2025, USD/JPY has been trading within a clearly defined downward channel, with bullish attempts failing to break this structure. The bullish correction observed this week has also fallen short of key resistance zones within the channel, reaffirming the relevance of this bearish formation in the short term.
- RSI: The RSI line is oscillating around the midpoint of 50, but has begun to show a slight downward slope, which may indicate increasing bearish momentum. If this slope steepens, selling pressure on USD/JPY could gain strength.
- TRIX: The TRIX line continues to oscillate below the neutral 0 level, indicating that the underlying strength based on moving averages remains consistently bearish. As long as TRIX maintains this behavior, downward pressure on USD/JPY could persist in the sessions ahead.
Key Levels:
- 149.526 – Distant Resistance: This level coincides with the 200-period simple moving average. Bullish moves toward this zone could pose a technical threat to the current bearish structure.
- 145.969 – Current Resistance: This level corresponds to the top of the descending channel and aligns with the 50-period simple moving average. It could act as a barrier to bullish corrections in the short term.
- 140.792 – Key Support: This is the recent low reached by price movements. A sustained drop to this level could reinforce the bearish bias and extend the ongoing downtrend.
Written by Julian Pineda, CFA – Market Analyst
Follow him at: @julianpineda25
Related tags:
Latest market news




The complete CFD trading experience
Award-winning platforms, competitive spreads, low commissions and dedicated support.
We live and breathe the markets and are dedicated to helping traders realise their ambitions as we continue to set the industry bar.
Economic calendar
Web Trader platform
Our sophisticated web-based platform is packed with features.
Related articles
USD/MXN Analysis: Is Super Peso Starting to Fade?
Over recent trading sessions, the Mexican peso has continued to show signs of weakness against the U.S. dollar. This can already be seen in USD/MXN, which has gained more than 1.7% over the last three sessions, highlighting sustained buying pressure in favor of the dollar in the short term.
Canadian Dollar Analysis: USD/CAD Returns to July Highs Ahead of NFP
The Canadian dollar continues to face one of its most challenging environments in recent months when it comes to maintaining strength against the U.S. dollar. The weakness of the Canadian currency is clearly reflected in USD/CAD, which has now recorded nine consecutive bullish sessions and gained more than 1.7% during that period.

US Dollar Technical Outlook: DXY Bulls Meet Resistance at Yearly Highs 10 1 2026
The U.S. Dollar has held firm despite fading Fed hike bets, but Friday’s payrolls could test the rally’s staying power.

StoneX Europe Ltd may make third party material available on this website which may contain information included but not limited to the conditions of financial markets. The material is for information purposes only and does not contain, and should not be construed as containing, investment advice and/or investment recommendation and/or an investment research and/or an offer of or solicitation for any transactions in financial instruments; any decision to enter into a specific transaction shall be made by the client following an assessment by him/her of their situation.
StoneX Europe Ltd makes no representation or warranty and assumes no liability as to the accuracy or completeness of the information provided, nor any loss arising from any investment based on a recommendation, forecast or other information supplied. You should always seek independent advice as to your suitability to speculate in any related markets and your ability to assume the associated risks, if you are at all unsure. We are not under any obligation to update any such material. Any opinion made may be personal to the author and may not reflect the opinion of StoneX Europe Ltd.