





USD/JPY Defends Rebound from Monthly Low Ahead of BoJ Rate Decision
USD/JPY seems to be defending the rebound from the monthly low (139.89) as it attempts to retrace the decline from the start of the week.
Share this:

Japanese Yen Outlook: USD/JPY
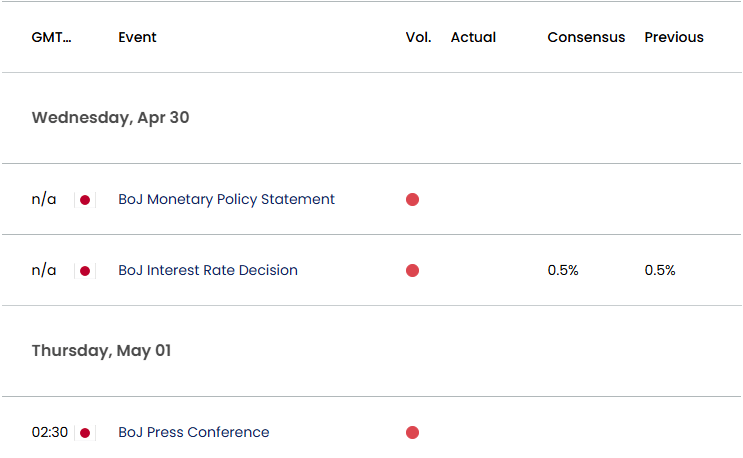
USD/JPY seems to be defending the rebound from the monthly low (139.89) as it attempts to retrace the decline from the start of the week, and the Bank of Japan (BoJ) interest rate decision may keep the exchange rate afloat as the central bank is expected to retain the current policy.
USD/JPY Defends Rebound from Monthly Low Ahead of BoJ Rate Decision
Keep in mind, USD/JPY bounced back ahead of the 2024 low (139.58) to pull the Relative Strength Index (RSI) above 30, and the exchange rate may stage a larger recovery as the BoJ remains reluctant to pursue a rate-hike cycle.
Join David Song for the Weekly Fundamental Market Outlook webinar.
David provides a market overview and takes questions in real-time. Register Here
Looking ahead, the BoJ is anticipated to keep interest rates on hold as the central bank insists that ‘in the second half of the projection period of the January 2025 Outlook for Economic Activity and Prices, underlying CPI inflation is likely to be at a level that is generally consistent with the price stability target.’
Japan Economic Calendar
In turn, more of the same from the BoJ may drag on the Japanese Yen as the central bank sticks to a wait-and-see approach, but USD/JPY may struggle to retain the rebound from the monthly low (139.89) should Governor Kazuo Ueda and Co. show a greater willingness to further normalize monetary policy.
With that said, swings in the carry trade may sway USD/JPY amid the diverging paths between the BoJ and Federal Reserve, but the exchange rate may further retrace the decline from the start of the month should it continue to hold above the 2024 low (139.58).
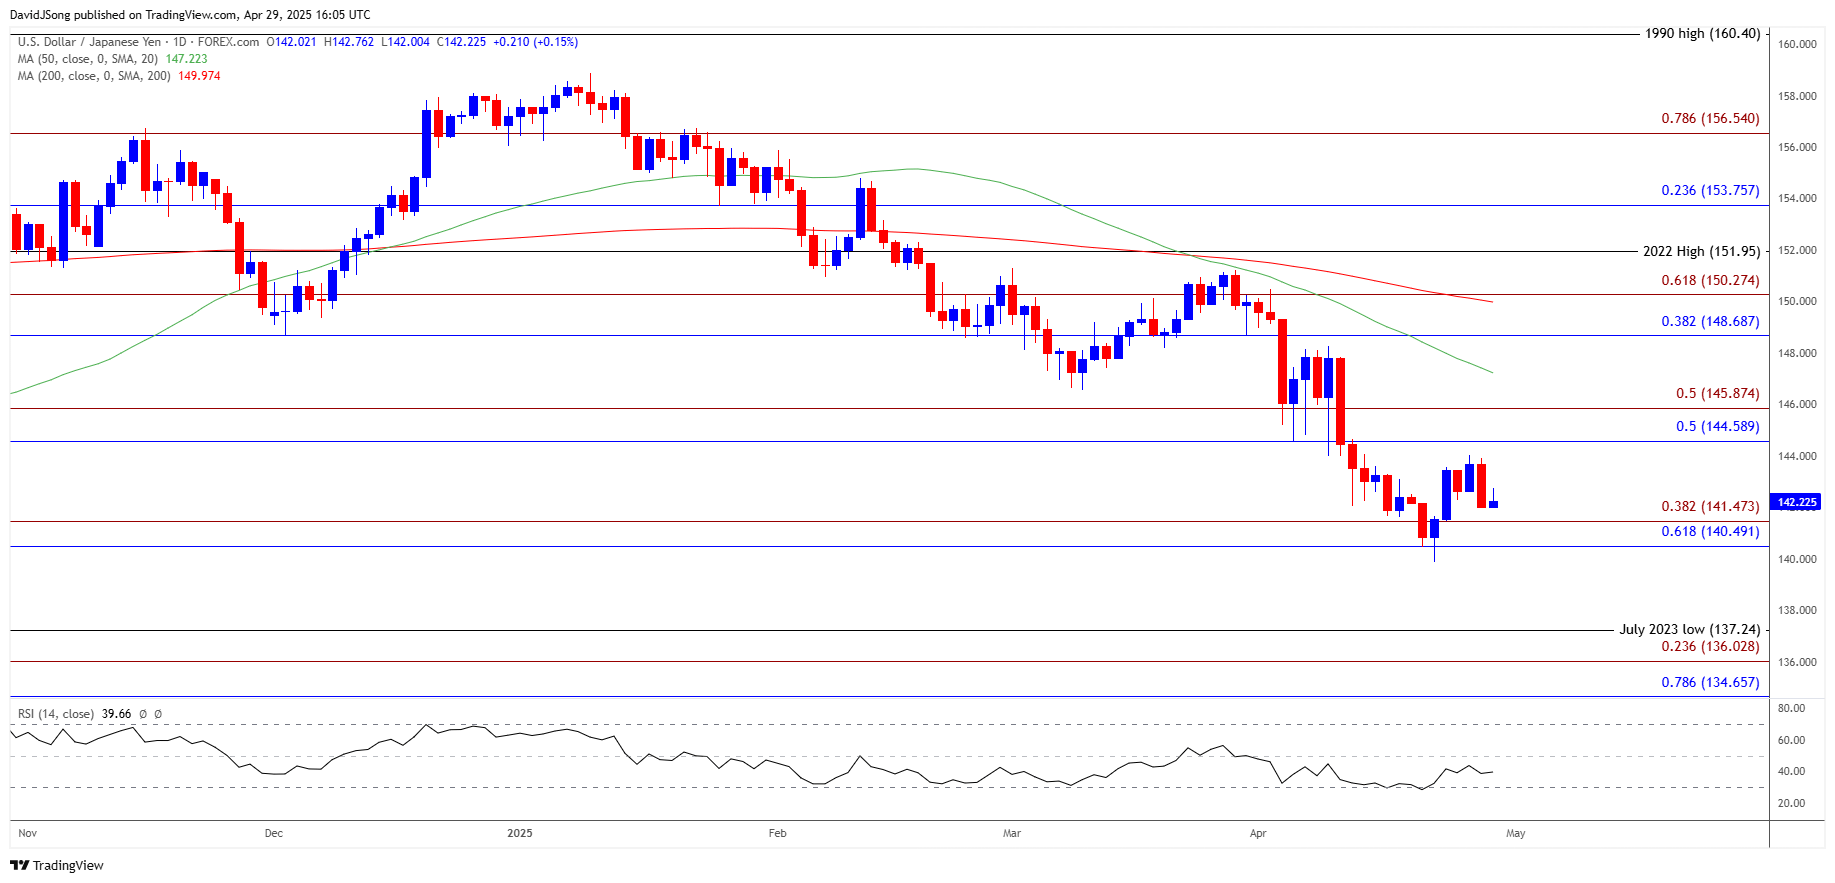
USD/JPY Price Chart – Daily
Chart Prepared by David Song, Senior Strategist; USD/JPY on TradingView
- USD/JPY holds above the 2024 low (139.58) amid the failed attempts to close below the 140.50 (61.8% Fibonacci retracement) to 141.50 (38.2% Fibonacci extension) zone, with a move/close above the 144.60 (50% Fibonacci retracement) to 145.90 (50% Fibonacci extension) region bringing the 50-Day SMA (147.22) on the radar.
- Next area of interest comes in around 148.70 (38.2% Fibonacci retracement) to 150.30 (61.8% Fibonacci extension), but USD/JPY may continue to track the negative slope in the moving average as long as it holds below the indicator.
- As a result, USD/JPY may stage further attempts to test the 2024 low (139.58), with a close below the 140.50 (61.8% Fibonacci retracement) to 141.50 (38.2% Fibonacci extension) zone bringing the July 2023 low (137.24) on the radar.
Additional Market Outlooks
British Pound Forecast: GBP/USD on Cusp of Testing 2024 High
Euro Forecast: EUR/USD Defends Weekly Low Ahead of Euro Area GDP Report
AUD/USD V-Shape Recovery Stalls Ahead of December High
Gold Price Coils Above 50-Day SMA
--- Written by David Song, Senior Strategist
Follow on Twitter at @DavidJSong
Related tags:
Latest market news




The complete CFD trading experience
Award-winning platforms, competitive spreads, low commissions and dedicated support.
We live and breathe the markets and are dedicated to helping traders realise their ambitions as we continue to set the industry bar.
Economic calendar
Web Trader platform
Our sophisticated web-based platform is packed with features.
Related articles

USD/JPY Weekly Outlook: AI earnings could overshadow the Fed and BoJ
AI sentiment has become a major driver of US Treasury yields and USD/JPY. With Microsoft, Alphabet and Amazon reporting this week, central bank decisions may have competition for traders' attention.

EUR/JPY Hits Its Most Oversold Since 2024 on French Debt
USD/JPY technical analysis shows an intact long-term uptrend, while EUR/JPY sits at oversold extremes last seen in 2024 on French debt uncertainty.


USD/JPY Analysis: NFP Eases Fed Concerns and the Yen Fails to Respond
Indecision continues to be a defining feature of the yen's recent price action. This can be seen in USD/JPY, which has posted average fluctuations of just 0.4% over the last three trading sessions, failing to establish a clear direction and reinforcing an increasingly evident neutral bias.

StoneX Europe Ltd may make third party material available on this website which may contain information included but not limited to the conditions of financial markets. The material is for information purposes only and does not contain, and should not be construed as containing, investment advice and/or investment recommendation and/or an investment research and/or an offer of or solicitation for any transactions in financial instruments; any decision to enter into a specific transaction shall be made by the client following an assessment by him/her of their situation.
StoneX Europe Ltd makes no representation or warranty and assumes no liability as to the accuracy or completeness of the information provided, nor any loss arising from any investment based on a recommendation, forecast or other information supplied. You should always seek independent advice as to your suitability to speculate in any related markets and your ability to assume the associated risks, if you are at all unsure. We are not under any obligation to update any such material. Any opinion made may be personal to the author and may not reflect the opinion of StoneX Europe Ltd.