





Using the RSI to Trade in Ranges EURUSD
The RSI can be a powerful tool when used in combination with other technical tools
Share this:

With the plethora of tape bombs over the last few days and weeks regarding the on-again/off-again negotiations regarding both Brexit and the US fiscal stimulus package, traders have become somewhat immune. It seems that no longer do comments such as “walking away from the table”, “close to a deal”, and “ready to put pen to paper” matter. Until something is actually done, in writing, will the markets pay attention. Some of this can be seen in the price action of the EUR/USD over the last few months.
EUR/USD
Tradingview, City Index
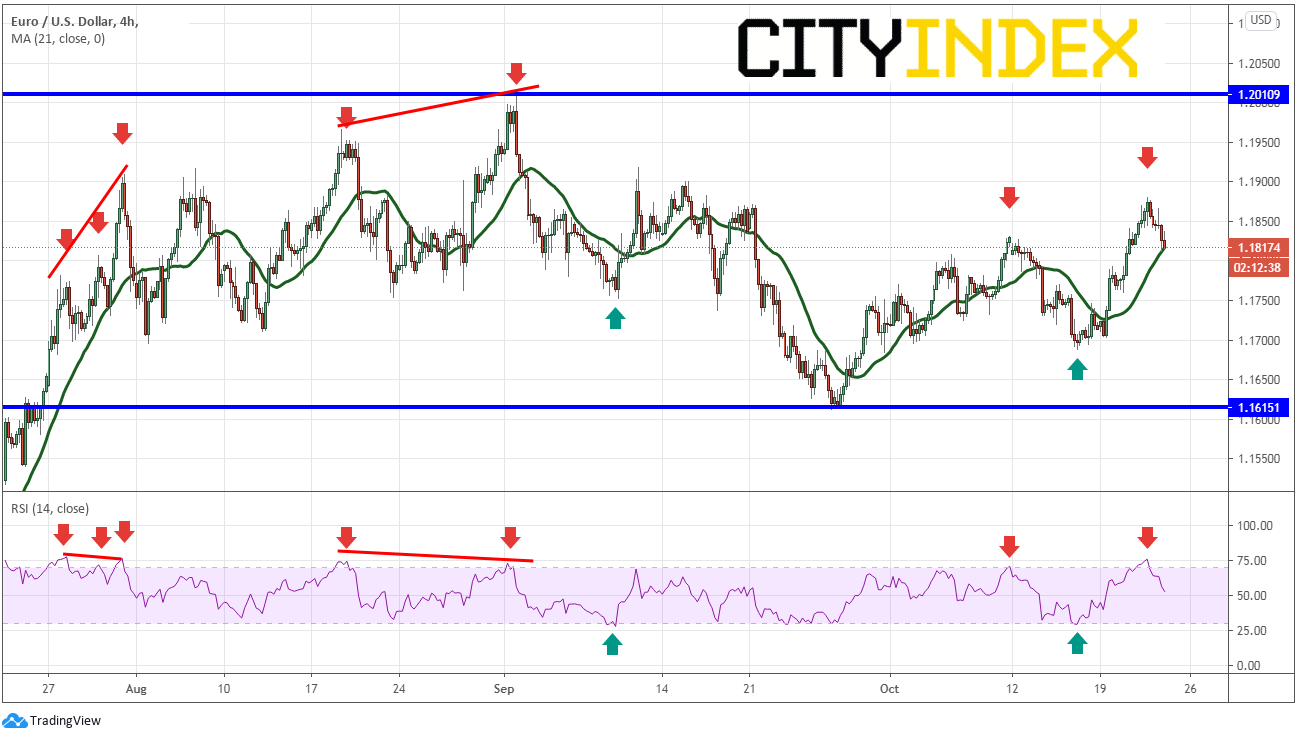
From the end of July until today, a 240-minute EUR/USD chart shows that the pair has been trading in roughly a range of 400 pips between 1.1615 and 1.2010. RSI indicators, in combination with other technical tools, can be used to look for spots to enter a trade. The RSI moves on a scale between the range of 0-100. When the line moves above 70, the RSI indicator is considered overbought, and sellers may soon take control. When the line moves below 30, the RSI indicator is considered oversold, and buyers may soon take control. The arrows in the above example show where the RSI moved into overbought or oversold conditions, and price soon reversed direction.
All oscillators should never be used alone. This is true for the RSI as well. There is potential for overbought to become overbought”er” and oversold to become oversold”er”. It is best to use them in combination with other technical indicators. When there is a confluence of indicators, traders will have more confidence to enter a trade. Trendlines, support and resistance, moving averages and divergence can be used as criteria to both enter and exit trades.
As an example, on July 31st:
Tradingview, City Index
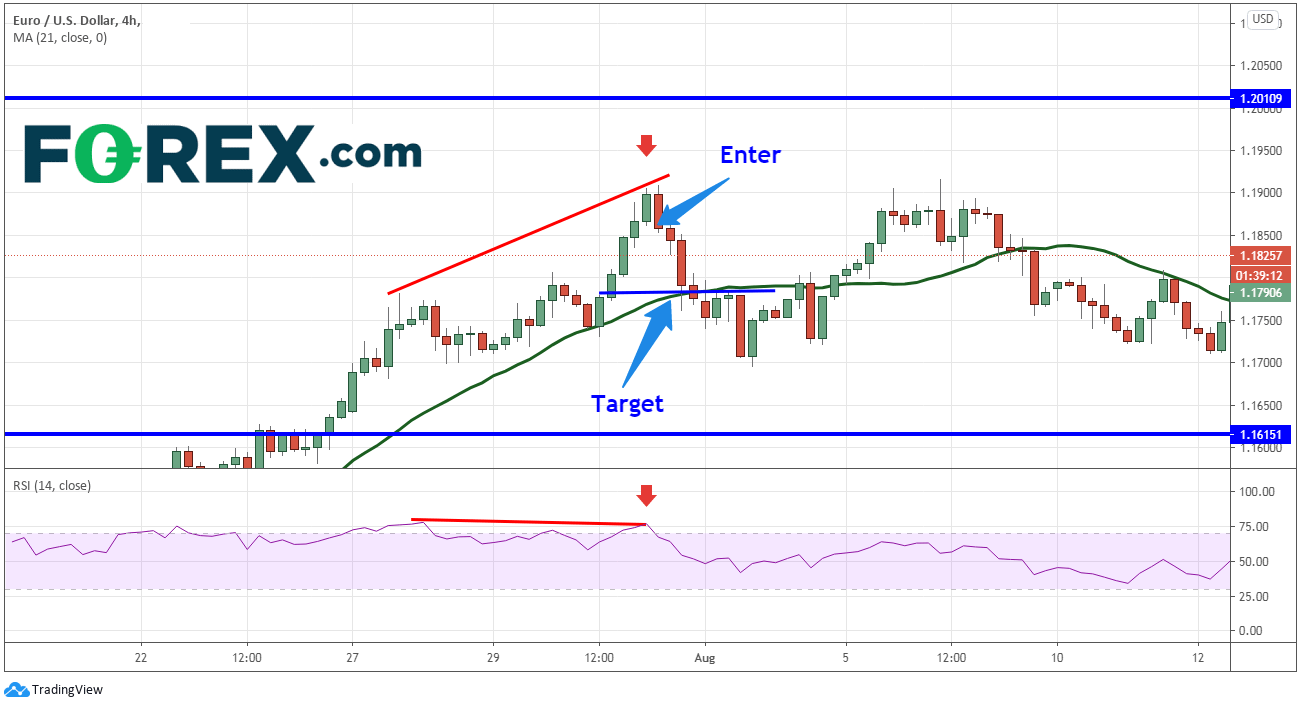
1) The RSI moved into overbought territory and….
2) The RSI is diverging price. EUR/USD now moves onto the radar.
3) Price is just above 1.1900 (psychological round number resistance).
4) The next 240-minute candle is a bearish engulfing candle.
If one were to enter a short EUR/USD trade at the close of the bearish engulfing candle, 1.1858, a target could be the 21-Day Moving Average near 1.1775, which also near horizontal support. 2 candles later, price hit the target and the RSI was back in neutral territory.
The RSI can be a powerful tool when used in combination with other technical tools, especially in trading ranges. Along with proper risk/management, the RSI can help traders make better decisions.
With the plethora of tape bombs over the last few days and weeks regarding the on-again/off-again negotiations regarding both Brexit and the US fiscal stimulus package, traders have become somewhat immune. It seems that no longer do comments such as “walking away from the table”, “close to a deal”, and “ready to put pen to paper” matter. Until something is actually done, in writing, will the markets pay attention. Some of this can be seen in the price action of the EUR/USD over the last few months.
EUR/USD
Tradingview, FOREX.com
From the end of July until today, a 240-minute EUR/USD chart shows that the pair has been trading in roughly a range of 400 pips between 1.1615 and 1.2010. RSI indicators, in combination with other technical tools, can be used to look for spots to enter a trade. The RSI moves on a scale between the range of 0-100. When the line moves above 70, the RSI indicator is considered overbought, and sellers may soon take control. When the line moves below 30, the RSI indicator is considered oversold, and buyers may soon take control. The arrows in the above example show where the RSI moved into overbought or oversold conditions, and price soon reversed direction.
All oscillators should never be used alone. This is true for the RSI as well. There is potential for overbought to become overbought”er” and oversold to become oversold”er”. It is best to use them in combination with other technical indicators. When there is a confluence of indicators, traders will have more confidence to enter a trade. Trendlines, support and resistance, moving averages and divergence can be used as criteria to both enter and exit trades.
As an example, on July 31st:
Tradingview, FOREX.com
1) The RSI moved into overbought territory and….
2) The RSI is diverging price. EUR/USD now moves onto the radar.
3) Price is just above 1.1900 (psychological round number resistance).
4) The next 240-minute candle is a bearish engulfing candle.
If one were to enter a short EUR/USD trade at the close of the bearish engulfing candle, 1.1858, a target could be the 21-Day Moving Average near 1.1775, which also near horizontal support. 2 candles later, price hit the target and the RSI was back in neutral territory.
The RSI can be a powerful tool when used in combination with other technical tools, especially in trading ranges. Along with proper risk/management, the RSI can help traders make better decisions.
Latest market news




The complete CFD trading experience
Award-winning platforms, competitive spreads, low commissions and dedicated support.
We live and breathe the markets and are dedicated to helping traders realise their ambitions as we continue to set the industry bar.
Economic calendar
Web Trader platform
Our sophisticated web-based platform is packed with features.
Related articles
USDJPY Forecast Intervention Fears Clash with Dollar Strength
Recent trading sessions have produced mixed results for the Japanese yen. By the end of last week, USD/JPY had fallen by more than 1.00%, reflecting a modest recovery in the yen. However, the start of this week has seen the pair move slightly back in favor of the U.S. dollar, posting gains of around 0.04%.
AUD/USD forecast: Currency Pair of the Week | September 28, 2026
The week has started with stocks, gold, silver and bitcoin all falling, as crude oil rebounded and bond yields pushed further higher. Trump refusing to agree to Tehran’s proposal to re-open the Strait of Hormuz has left the markets disappointed. Still, reports that mediators are expected to hold talks with the two sides on an amended version of the 7-day proposal that Iran presented, keeps hopes alive that we may see some progress.


EUR/USD weekly outlook: Oil, inflation and NFP in focus
After coming under significant pressure in recent weeks, the EUR/USD came off its lows to finish the week on a positive note on Friday, albeit with only a mild rebound. That was not enough to prevent the exchange rate falling for the third consecutive week, as the US dollar and bond yields rallied across the board.
StoneX Europe Ltd may make third party material available on this website which may contain information included but not limited to the conditions of financial markets. The material is for information purposes only and does not contain, and should not be construed as containing, investment advice and/or investment recommendation and/or an investment research and/or an offer of or solicitation for any transactions in financial instruments; any decision to enter into a specific transaction shall be made by the client following an assessment by him/her of their situation.
StoneX Europe Ltd makes no representation or warranty and assumes no liability as to the accuracy or completeness of the information provided, nor any loss arising from any investment based on a recommendation, forecast or other information supplied. You should always seek independent advice as to your suitability to speculate in any related markets and your ability to assume the associated risks, if you are at all unsure. We are not under any obligation to update any such material. Any opinion made may be personal to the author and may not reflect the opinion of StoneX Europe Ltd.