



Weekly Crypto Technical Outlook: Is Recovery Beginning?
As November comes to an end, the cryptocurrency market has begun to show a notable recovery over the past week’s price movements. At this point, the market as a whole has managed to close the week with consistent positive numbers, leaving behind the strong selling pressure that had dominated recently. Some cryptocurrencies have even risen more than 10% in the short term, marking a temporary bullish bias across the broader crypto market.
Share this:

As November comes to an end, the cryptocurrency market has begun to show a notable recovery over the past week’s price movements. At this point, the market as a whole has managed to close the week with consistent positive numbers, leaving behind the strong selling pressure that had dominated recently. Some cryptocurrencies have even risen more than 10% in the short term, marking a temporary bullish bias across the broader crypto market.
However, it is important to keep in mind that, despite this short-term rebound, the sharp decline of recent weeks continues to weigh on market sentiment. Confidence has not fully recovered, and this upward movement could still be a temporary bounce. To shift the longer-term outlook, a more consistent buying pressure would be needed in the coming sessions.


Performance of Major Cryptocurrencies
Source: Data - StoneX, Tradingview
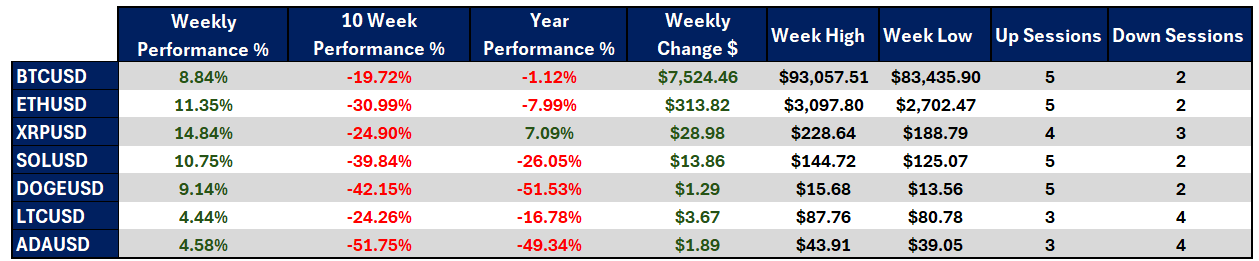
- The cryptocurrency that has recovered the most over the past seven sessions is Ripple, with a rise of 14.84% is becoming the strongest performer in the short term. On the other hand, Litecoin has also recovered, though more modestly, with a 4.44% rise, largely because LTC had been one of the coins that lost the least ground during previous declines, making its recovery more limited.
- Over the last ten weeks, despite recent recovery, the market still maintains a dominant bearish bias, with current prices far from levels seen ten weeks ago. The most depreciated remains Cardano, with a -51.75% drop, while Bitcoin has been the asset that best managed to recover part of its losses, showing a smaller decline of -19.72%.
- In the year-to-date comparison, except for Ripple, all major cryptocurrencies remain below their levels at the start of the year. Unless something changes meaningfully in the coming weeks, this could end as a negative year for most crypto assets. Ripple stands out as the only major cryptocurrency with positive performance (7.09%), while Doge continues to be the most depreciated of the year, with -51.53%, reflecting its high sensitivity relative to the broader crypto market.
- Despite Bitcoin briefly touching 83,000 USD earlier in the week, it now trades above 90,000 USD, reaching a weekly high of 93,000 USD, highlighting its short-term recovery.
- Overall, the week has been positive for crypto, and currencies such as Bitcoin, Ethereum, Solana, and Doge have recorded up to five consecutive bullish sessions, consolidating a buying bias in recent days.
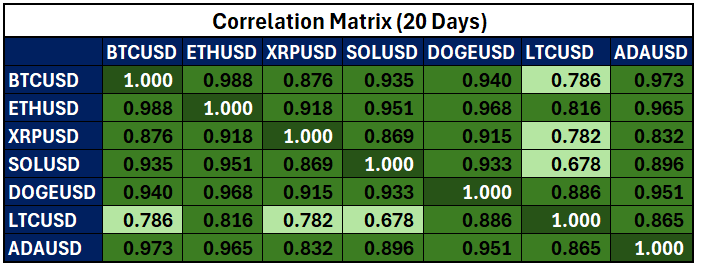
Colors from red to green – Red for negative correlations and green for positive correlations
Source: Data - StoneX, Tradingview
Since the recovery in cryptocurrencies began, most major cryptoassets have maintained a strong positive correlation with Bitcoin, with coefficients near or above 0.8 on average over the last 20 sessions. This indicates that the overall market has followed the positive momentum led by BTC. As Bitcoin has regained part of the market’s confidence, other cryptocurrencies have replicated those movements.
Likewise, correlations among cryptoassets excluding Bitcoin also show highly positive coefficients, generally above 0.8, reflecting a market moving in a synchronized manner toward a broad short-term buying bias. It is important to remember that these correlations can change as new information enters the market.
Bitcoin Shows Recovery but Still Holds a Downtrend
Source: StoneX, Tradingview
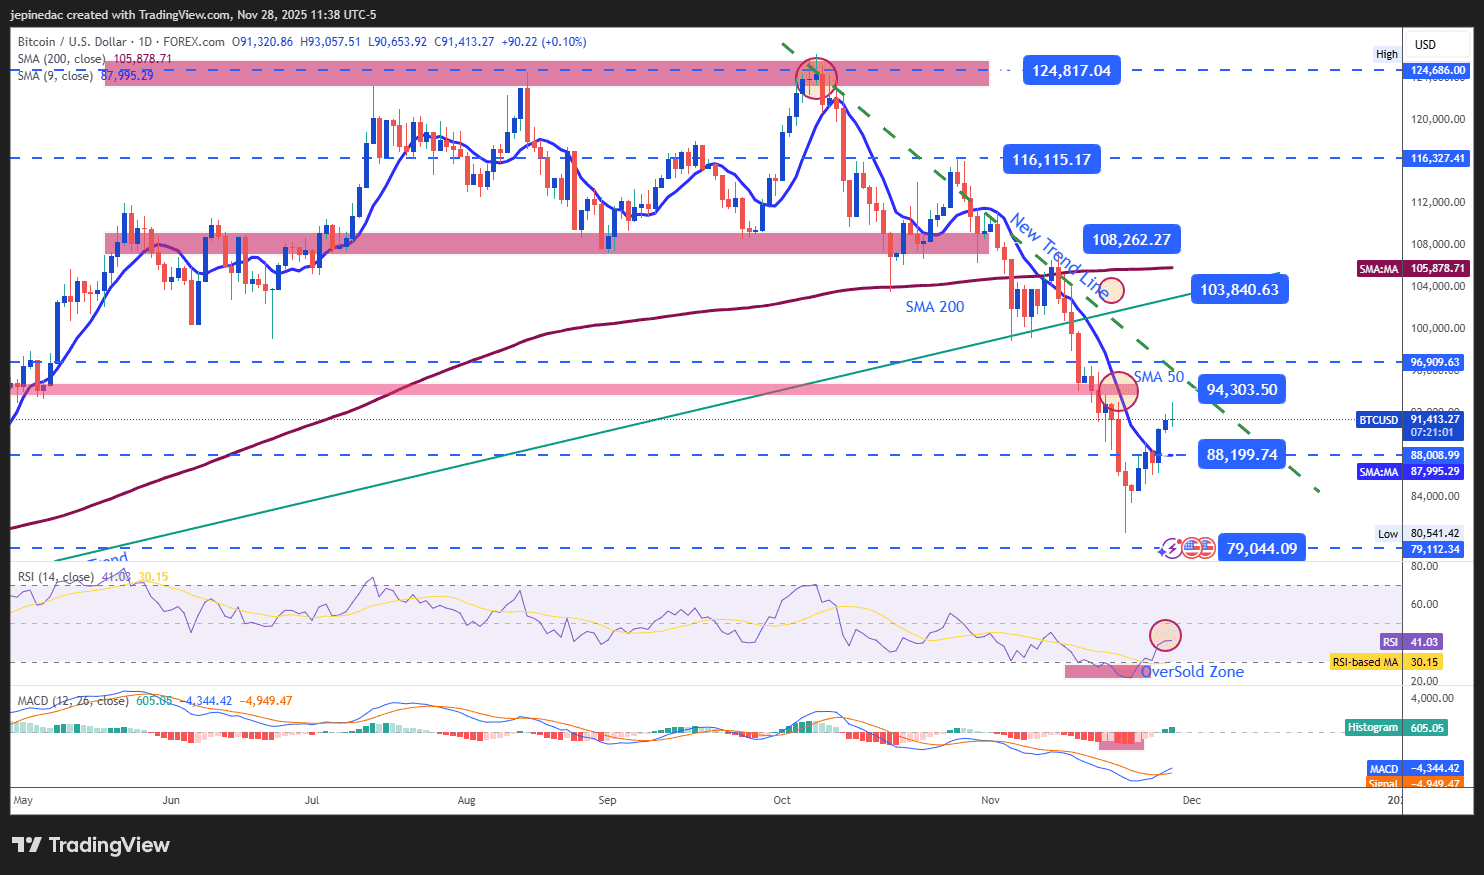
The week ended positively for Bitcoin, with a recovery of more than 8% and a consistent bullish bias. However, this movement remains, for now, a bullish correction within a broader bearish structure, since price action has still not broken the downtrend line that has been intact since early October.
Although the rebound is significant, the overall chart structure continues to show a dominant selling trend. To reverse it, a more aggressive buying pressure would be needed to invalidate the current bearish formation.
Indicators:
- Both the RSI and the MACD have begun to show positive signals, with an RSI that has exited oversold territory and now remains above the 50 level, indicating stronger buying momentum, while the MACD maintains a histogram oscillating above 0, reflecting improved strength in short-term moving averages. Taken together, these behaviors suggest that a dominant buying bias has begun to emerge, which could strengthen further if both indicators continue advancing consistently in the coming sessions.
Key Levels for Bitcoin:
- 94,000 USD – Major resistance: This is the most important resistance level, aligned with the downtrend line and with a neutrality zone seen in April. A consistent breakout could put the downtrend at risk and activate a stronger bullish bias.
- 88,199 USD – Nearby support: A short-term support level aligned with the 50-period moving average. If price retraces to this area, it could reflect market indecision and open the door to a sideways range.
- 79,000 USD – Final support: This marks the annual lows and functions as the most relevant bearish barrier. A breakdown could trigger a more aggressive selling phase and reinforce a more pronounced downtrend.
Ripple Is the Top Performer of the Week
Source: StoneX, Tradingview
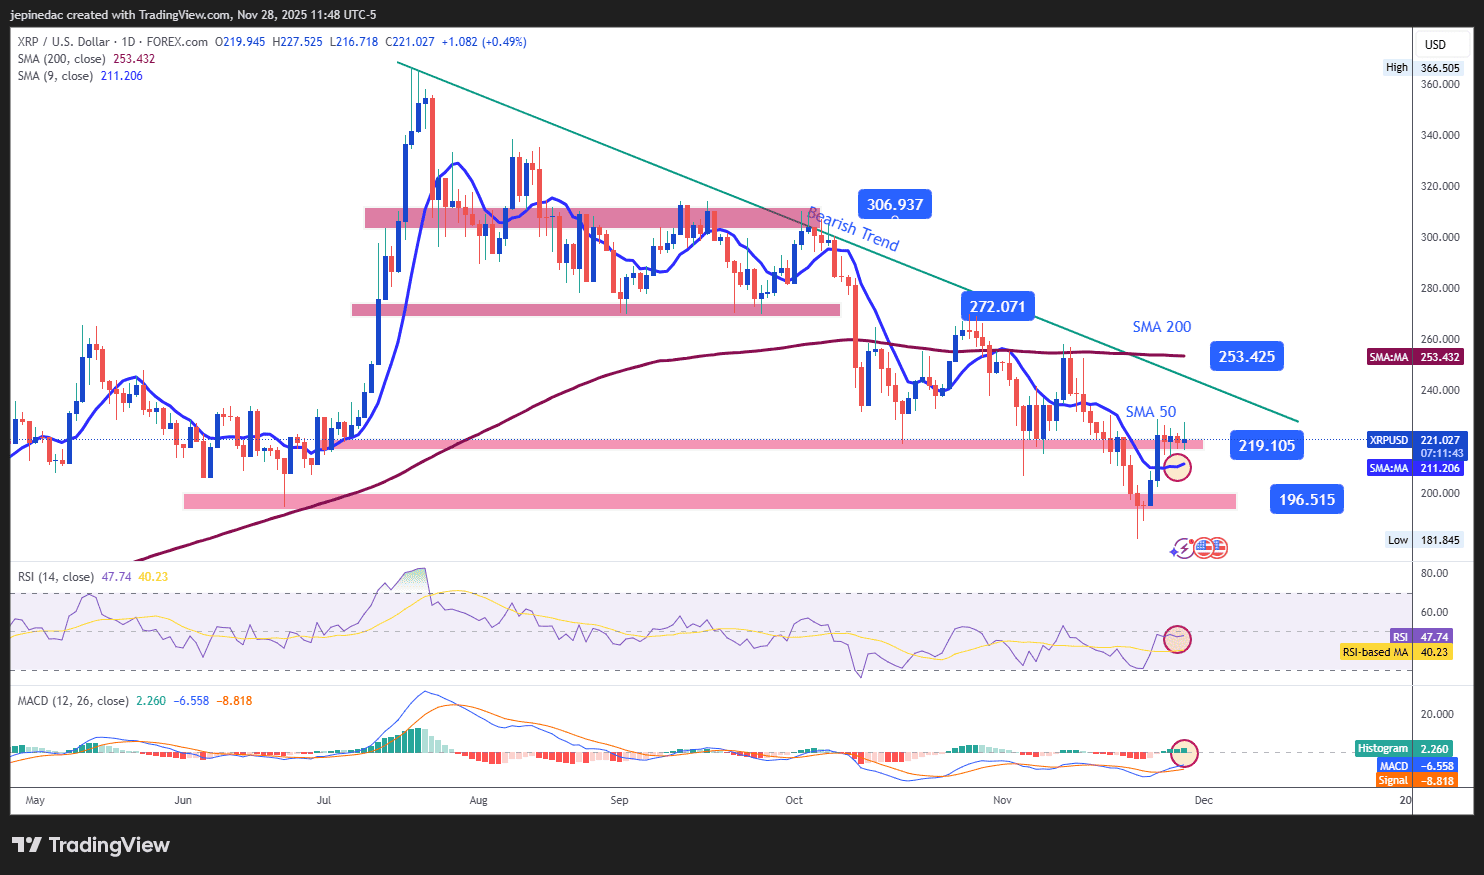
Ripple stood out this week with a gain above 14%. However, recent sessions show a neutral bias, preventing this growth from threatening the prevailing downtrend line that still dominates the medium-term outlook.
Although Ripple remains above the 50-period moving average, it must advance further to avoid being just a short-term correction and truly challenge the broader bearish structure.
Indicators:
- The MACD maintains a histogram oscillating above 0, highlighting increased buying strength in short-term moving averages. However, although the RSI has shown a relevant recovery, it remains below the neutral 50 level, suggesting a persistent neutrality in price momentum until RSI shows a stronger upward push.
Key Levels for Ripple:
- 253.425 – Major resistance: This corresponds to the most important bullish resistance level, marked by the 200-period simple moving average. A move toward this level could put an end to the long-standing bearish trend.
- 219.105 – Nearby barrier: A neutrality zone where price has stalled in recent sessions, and also during mid-2025. If price fails to break away from this area, a constant indecision scenario could persist.
- 196.515 – Final support: This represents the lows of the bearish trend. Returning to this zone could reactivate a consistent selling bias in Ripple.
Written by Julian Pineda, CFA, CMT – Market Analyst
Follow him at: @julianpineda25
Latest market news




The complete CFD trading experience
Award-winning platforms, competitive spreads, low commissions and dedicated support.
We live and breathe the markets and are dedicated to helping traders realise their ambitions as we continue to set the industry bar.
Economic calendar
Web Trader platform
Our sophisticated web-based platform is packed with features.
Related articles

Bitcoin Analysis: Caution Keeps BTC Below $85K
Despite Bitcoin's attempt to regain ground during the latest trading session, posting gains of more than 1.6%, the move has yet to signal a meaningful recovery in demand. The main reason is that, over recent weeks, price action has continued to develop within a broader phase of indecision, preventing BTC from reclaiming the key psychological barrier around $85,000 in a convincing manner.

BTC/USD: Dead-cat bounce or the start of another recovery?
Bitcoin has bounced aggressively after another test of its 50-day moving average, but tech futures remain under pressure. With equity correlations strengthening and bearish momentum building, can BTC/USD sustain the recovery?

Crypto Analysis: Are Red Numbers Returning to the Market?
October continues to unfold and a renewed sense of weakness has once again become evident across the cryptocurrency market. Over recent sessions, meaningful recoveries have been scarce and the sector's leading assets have started to move away from their recent highs
StoneX Europe Ltd may make third party material available on this website which may contain information included but not limited to the conditions of financial markets. The material is for information purposes only and does not contain, and should not be construed as containing, investment advice and/or investment recommendation and/or an investment research and/or an offer of or solicitation for any transactions in financial instruments; any decision to enter into a specific transaction shall be made by the client following an assessment by him/her of their situation.
StoneX Europe Ltd makes no representation or warranty and assumes no liability as to the accuracy or completeness of the information provided, nor any loss arising from any investment based on a recommendation, forecast or other information supplied. You should always seek independent advice as to your suitability to speculate in any related markets and your ability to assume the associated risks, if you are at all unsure. We are not under any obligation to update any such material. Any opinion made may be personal to the author and may not reflect the opinion of StoneX Europe Ltd.