



Weekly Crypto Technical Outlook: The Year Starts Slow and Neutral
The first full week of January has now come to an end, and for now, the cryptocurrency market is showing a largely neutral performance. While some assets managed to close the week with moderate gains, others posted meaningful corrections. This mixed performance reflects a persistent neutral sentiment that began to dominate the crypto market at the start of 2026.
Share this:

The first full week of January has now come to an end, and for now, the cryptocurrency market is showing a largely neutral performance. While some assets managed to close the week with moderate gains, others posted meaningful corrections. This mixed performance reflects a persistent neutral sentiment that began to dominate the crypto market at the start of 2026. As long as confidence fails to recover or sustained buying pressure does not emerge, this indecision could even give way to additional periods of weakness in the coming trading sessions.


Performance of Major Cryptocurrencies
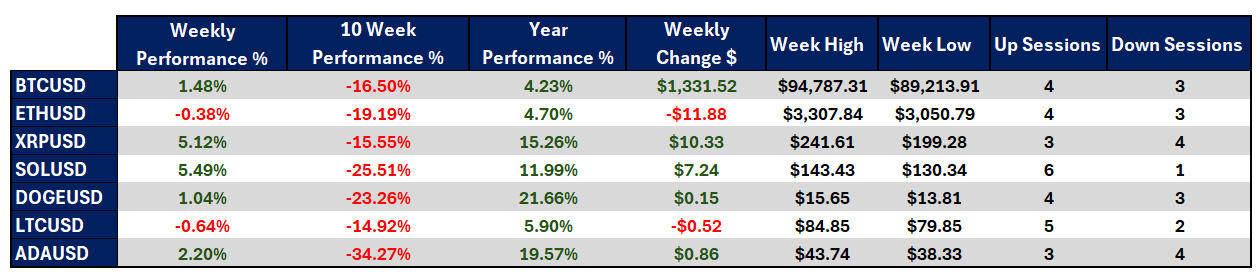
Source: Data - StoneX, Tradingview
- The cryptocurrency that showed the most consistent short-term recovery was Solana, posting a weekly gain of 5.49%, positioning it as one of the most relevant assets to monitor for short-term bullish moves. In contrast, Litecoin has been among the most affected in recent sessions, registering a decline of -0.64%, and displaying a clearly more neutral performance relative to the broader market.
- Looking at the past ten weeks, the crypto market as a whole continues to trade below levels seen toward the end of 2025. Cardano stands out in this context, with an accumulated decline of -34.27% compared to its price ten weeks ago, highlighting a still-dominant bearish bias in the medium term. Meanwhile, Litecoin has been one of the more stable cryptocurrencies, with a cumulative decline of -14.92%, suggesting relatively greater resilience despite recent weakness.
- A positive takeaway is that the crypto market overall has managed to hold above its 2026 opening levels. In this environment, Dogecoin is up 21.66% year-to-date, while Bitcoin shows a more moderate gain of 4.23% since the start of the year.
- However, although Bitcoin, as the market’s benchmark asset, reached a high near $95,000, it remains a point of concern that weekly lows around $89,000 continue to struggle against the $90,000 level. So far, sustained buying pressure above this key threshold has failed to materialize.
- Overall, the combination of isolated rebounds and corrective moves confirms that neutrality continues to dominate the crypto market. In the absence of meaningful catalysts, this sentiment may persist over the coming sessions.
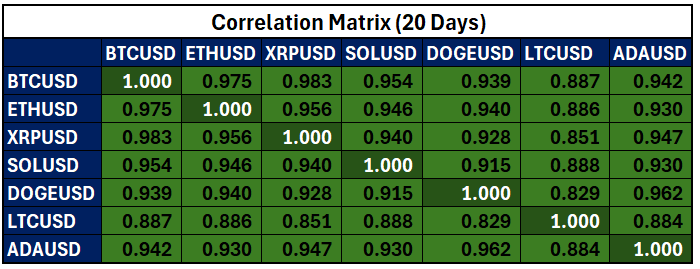
Red to green colors – red for negative correlations and green for positive correlations
Source: Data - StoneX, Tradingview
As short-term neutrality intensifies, most major cryptocurrencies continue to move in close correlation with Bitcoin. Currently, the correlation coefficient for the past 20 sessions stands above 0.8 across the broader market, indicating that recent bullish and corrective moves have been broad-based, rather than driven by asset-specific catalysts. It is important to note that correlation coefficients can change over time.
In this context, persistent neutrality and elevated correlations suggest that, despite attempts at a rebound in confidence, the market remains trapped in an environment of indecision affecting the crypto ecosystem as a whole. Until clearer directional signals emerge, this dynamic is likely to persist in the sessions ahead.
A New Sideways Channel Forms in Bitcoin

Source: StoneX, Tradingview
Although Bitcoin managed to sustain meaningful buying pressure early in the week, this was followed by short-term bearish corrections, leading once again to the formation of a sideways channel. Currently, the range is defined by resistance near $94,000 and support around $85,000. As long as prices fail to break decisively beyond either of these levels, the lack of clear direction is likely to continue limiting the development of a defined trend in the coming sessions.
Indicators:
- Both the RSI and MACD remain oscillating near their neutral levels (50 for RSI and 0 for MACD), confirming a balance of forces between buyers and sellers. As long as both indicators maintain this behavior, short-term indecision is likely to continue dominating Bitcoin price action.
Key Levels:
- $93,700 – Key resistance: This level corresponds to the highs of recent weeks and the upper boundary of the sideways channel. A sustained breakout above this area could open the door to a more meaningful bullish bias and the formation of a more clearly defined uptrend.
- $89,270 – Nearby barrier: A level aligned with the 50-period simple moving average. Repeated price action around this zone would reinforce neutrality and favor the continuation of the sideways range.
- $85,292 – Major support: A level corresponding to the lows observed toward the end of 2025. A return to this area could reactivate the bearish trend that dominated the final months of last year.
Solana Fights to Break Out of Its Downtrend
Source: StoneX, Tradingview
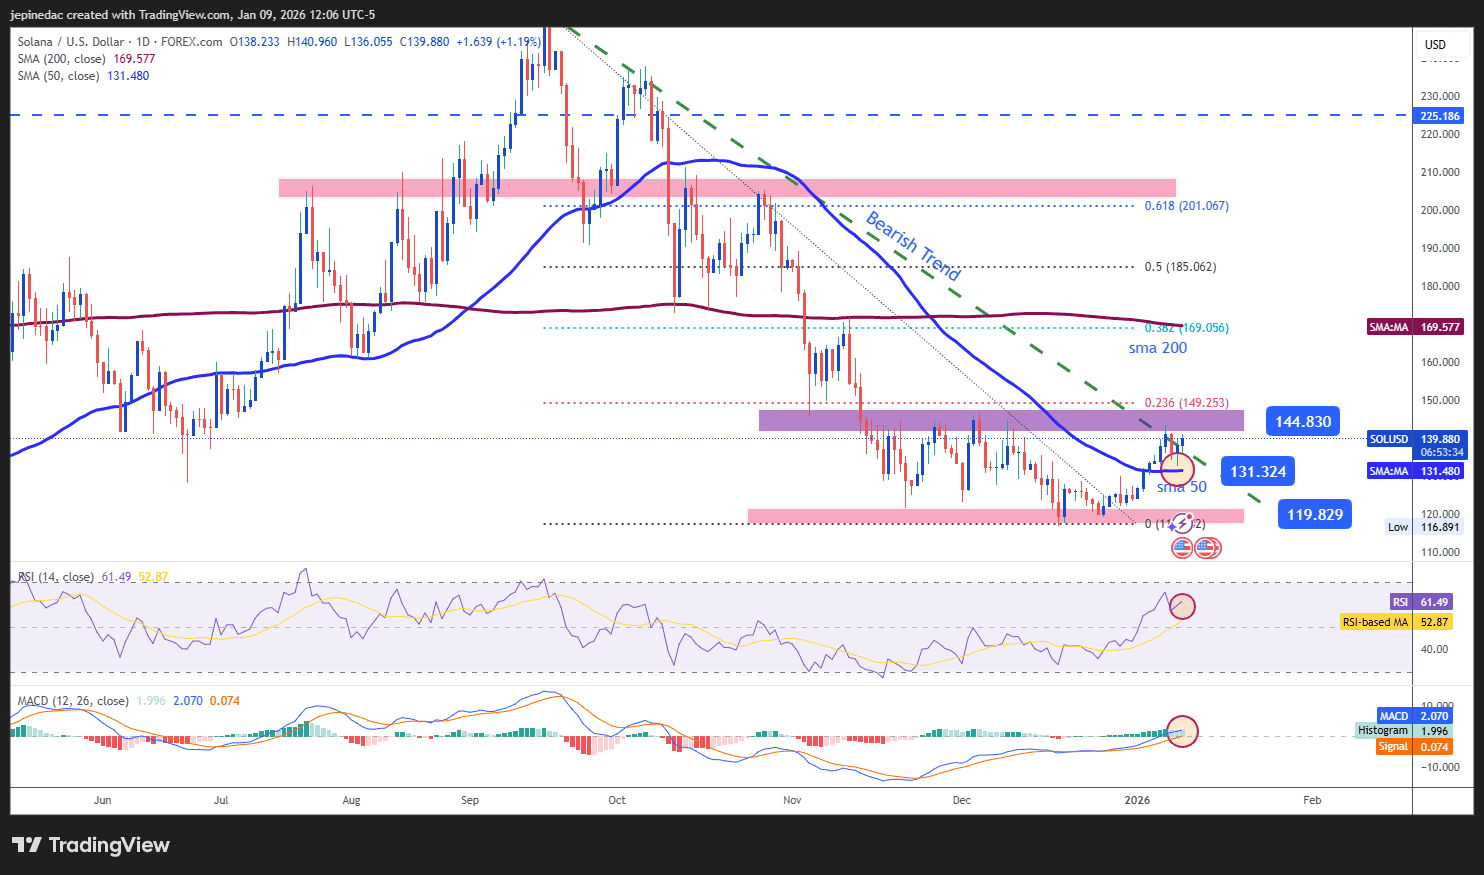
Solana has not only been the best-performing cryptocurrency on a weekly basis, but it is also once again testing a long-term bearish trendline. If buying pressure holds in the short term, room could open for the formation of a new bullish trend, allowing the buying bias to gain traction during the first weeks of 2026.
Indicators:
- Unlike Bitcoin, both the RSI and MACD for Solana remain above their neutral levels, indicating that buying momentum and moving average strength are currently dominating the short term. If this dynamic continues, it could reinforce a more significant buying pressure in Solana price action over the coming sessions.
Key Levels:
- 144.83 – Key resistance: A critical level that aligns with the long-term bearish trendline, recent highs, and the area near the 23.6% Fibonacci retracement. A sustained breakout above this level could not only invalidate the bearish structure but also pave the way for a new short-term bullish trend.
- 131.32 – Nearby barrier: A neutrality zone associated with the 50-period simple moving average. Persistent price action around this level could favor the formation of a short-term sideways range.
- 119.82 – Major support: A level marking the lows of recent weeks. A return toward this zone could reinforce the dominance of the bearish trend that has characterized Solana over the past several months.
Written by Julian Pineda, CFA, CMT – Market Analyst
Follow him on: @julianpineda25
Latest market news




The complete CFD trading experience
Award-winning platforms, competitive spreads, low commissions and dedicated support.
We live and breathe the markets and are dedicated to helping traders realise their ambitions as we continue to set the industry bar.
Economic calendar
Web Trader platform
Our sophisticated web-based platform is packed with features.
Related articles

Bitcoin Analysis: Caution Keeps BTC Below $85K
Despite Bitcoin's attempt to regain ground during the latest trading session, posting gains of more than 1.6%, the move has yet to signal a meaningful recovery in demand. The main reason is that, over recent weeks, price action has continued to develop within a broader phase of indecision, preventing BTC from reclaiming the key psychological barrier around $85,000 in a convincing manner.

BTC/USD: Dead-cat bounce or the start of another recovery?
Bitcoin has bounced aggressively after another test of its 50-day moving average, but tech futures remain under pressure. With equity correlations strengthening and bearish momentum building, can BTC/USD sustain the recovery?

Crypto Analysis: Are Red Numbers Returning to the Market?
October continues to unfold and a renewed sense of weakness has once again become evident across the cryptocurrency market. Over recent sessions, meaningful recoveries have been scarce and the sector's leading assets have started to move away from their recent highs
StoneX Europe Ltd may make third party material available on this website which may contain information included but not limited to the conditions of financial markets. The material is for information purposes only and does not contain, and should not be construed as containing, investment advice and/or investment recommendation and/or an investment research and/or an offer of or solicitation for any transactions in financial instruments; any decision to enter into a specific transaction shall be made by the client following an assessment by him/her of their situation.
StoneX Europe Ltd makes no representation or warranty and assumes no liability as to the accuracy or completeness of the information provided, nor any loss arising from any investment based on a recommendation, forecast or other information supplied. You should always seek independent advice as to your suitability to speculate in any related markets and your ability to assume the associated risks, if you are at all unsure. We are not under any obligation to update any such material. Any opinion made may be personal to the author and may not reflect the opinion of StoneX Europe Ltd.